Archives For resources

what happens when you update a row of a table ? not much, you could think. but in fact there are lots and lots of things happening in the background from which you can learn how the database works. this post will follow a simple one row update and shows what’s happening behind the scenes.

i will start by creating a tiny little table and adding one row to it:

CREATE TABLE T1 ( A NUMBER )
       TABLESPACE USERS;
INSERT INTO T1 (A)
       VALUES (1);
COMMIT;

this is the starting point. because we will need this information later lets record four things:
1) the block number of the row we just created
2) the object id of the table in the data dictionary
3) the sid of the session
4) the session’s address

-- rowid of the row
SELECT rowid
  FROM t1
 WHERE A = 1;
ROWID
------------------
AAADb4AAEAAAAF9AAA
-- block number of the row
SELECT dbms_rowid.rowid_block_number('AAADb4AAEAAAAF9AAA') block_no
  FROM dual;
BLOCK_NO
----------
381
-- object id of the table
SELECT object_id
  FROM all_objects
 WHERE owner = USER
   AND object_type = 'TABLE'
   AND object_name = 'T1';
OBJECT_ID
----------
14072
-- the session id of the session which sends the update
SELECT SYS_CONTEXT('userenv','SID') sid
  FROM dual;
SID
---
32
-- the same sessions address
SELECT saddr
  FROM v$session
 WHERE sid = 32;
SADDR
----------------
000000006F680A28

so by now we know the object id ( which is 14072 ), the block number of the block containing the row ( which is 381 ), the session id ( which is 32 in my case ) and the session’s address ( which is 000000006F680A28 ).

ready to update ?

UPDATE T1
SET A = 2
WHERE A = 1;
1 row updated.

at this point it is important to leave the transaction open ( to not commit ). i will start a second sqlplus session and leave the session which issues the update as is.

the obvious things first. each insert/update/delete will start a transaction and as we did not commit our update we should be able to see the transaction:

SELECT addr
, ubafil
, ubablk
, ubarec
, status
, xid
, start_scn
FROM v$transaction
WHERE ses_addr = '000000006F680A28';
ADDR UBAFIL UBABLK UBAREC STATUS XID START_SCN
---------------- ---------- ---------- ---------- ------ ---------------- ----------
000000006DF332D8 3 483 11 ACTIVE 0100100022010000 958658

as expected there is an active transaction for our update statement. because each transaction will change some data ( if there is not rollback ) some undo must be generated. from the output above we can learn:
1. the datafile containing the undo block has file number 3
2. the block containing the undo is block number 483
3. the undo record is 11

before taking a look at the undo block lets see what information oracle has about our data block in v$bh ( which lists the buffer headers ):

col dirty for a5
col temp for a5
col ping for a5
col stale for a5
col stale for a5
col direct for a5
col status for a6
col objd for 99999
col block# for 999999
SELECT file#
, status
, dirty
, temp
, ping
, stale
, direct
, objd
, block#
FROM v$bh
WHERE objd = 14072
AND block# = 381;
FILE# STATUS DIRTY TEMP PING STALE DIREC OBJD BLOCK#
---------- ------ ----- ----- ----- ----- ----- ------ -------
4 cr N N N N N 14072 381
4 xcur N N N N N 14072 381

so v$bh reports two copies of the block header, one in “consitent read” the other in “exclusive” mode non of them dirty, temporary, pinged, stale or direct.

the exclusive one is the original block while the cr one is the copy we got when we issued the update. if you’d do a rollback of the update and resend the same update statement you’d receive another “cr” copy of the block. can you imagine why ? because readers do not block writers and writers do not block readers. for others sessions to be able to view the block as it really is ( the update is not yet commited ) oracle creates copies of blocks to construct a read consistant view of the data. you should keep this in mind when sizing your pools.

happily oracle provides a way to look at the contents of a block. lets do a dump of our undo block:

ALTER SESSION SET TRACEFILE_IDENTIFIER='my_dumps';
ALTER SYSTEM DUMP DATAFILE 3 BLOCK 483;

as the select from v$transaction tells us that our undo record is 11, we will take a look at this record only. if you open the trace file scroll down to your undo record you should see a similar output than this:

*-----------------------------
* Rec #0xb slt: 0x10 objn: 14072(0x000036f8) objd: 14072 tblspc: 4(0x00000004)
* Layer: 11 (Row) opc: 1 rci 0x00
Undo type: Regular undo Begin trans Last buffer split: No
Temp Object: No
Tablespace Undo: No
rdba: 0x00000000Ext idx: 0
flg2: 0
*-----------------------------
uba: 0x00c001e3.0036.09 ctl max scn: 0x0000.000e4630 prv tx scn: 0x0000.000e4631
txn start scn: scn: 0x0000.000ea07f logon user: 42
prev brb: 12583394 prev bcl: 0
KDO undo record:
KTB Redo
op: 0x03 ver: 0x01
compat bit: 4 (post-11) padding: 1
op: Z
Array Update of 1 rows:
tabn: 0 slot: 0(0x0) flag: 0x2c lock: 0 ckix: 0
ncol: 1 nnew: 1 size: 0
KDO Op code: 21 row dependencies Disabled
xtype: XAxtype KDO_KDOM2 flags: 0x00000080 bdba: 0x0100017d hdba: 0x0100017a
itli: 2 ispac: 0 maxfr: 4858
vect = 0
col 0: [ 2] c1 02

if you wonder why this is record 11, “#0xb” translates to 11:

select to_number('b','X') dec
from dual;
DEC
----------
11

what can we learn from here:
1) we can see the tablespace number and the object which is affected:

* Rec #0xb slt: 0x10 objn: 14072(0x000036f8) objd: 14072 tblspc: 4(0x00000004)

2) the start scn ( system change number ) is recorded as long with the user who started the transaction

txn start scn: scn: 0x0000.000ea07f logon user: 42

000e2f90 translates to 929670 and 42 is the user_id reported in all_users for the user who started the transaction.
3) one row will be updated:

Array Update of 1 rows:
tabn: 0 slot: 0(0x0) flag: 0x2c lock: 0 ckix: 0
ncol: 1 nnew: 1 size: 0
KDO Op code: 21 row dependencies Disabled
xtype: XAxtype KDO_KDOM2 flags: 0x00000080 bdba: 0x0100017d hdba: 0x0100017a
itli: 2 ispac: 0 maxfr: 4858
vect = 0
col 0: [ 2] c1 02

other people described the meanings of all the keywords and flags, so i will not just re-type them here ( you may, for example, want to check julian dyke’s website ).
for now, it is just important to notice that the first column of the table ( col 0 ) will be changed by 2 bytes ( [2] ) and the values is 1 ( 02 – 1 ).  oracle prefixes numeric values ( c1 ), so we may ignore the first 2 bytes.

what else is happening in the background? as stated in earlier posts, things need protections. lets see if we can find some locks for our session:

SELECT sid
, id1
, id2
, lmode
, request
FROM v$lock
WHERE sid = 32;
SID ID1 ID2 LMODE REQUEST
---------- ---------- ---------- ---------- ----------
32 100 0 4 0
32 14072 0 3 0
32 65552 290 6 0

the lmodes translate to: 4 = Edition enqueue (AE), 3 = DML (TM), 6 = Transaction (TX).

i am not sure, but i think the edition enqueue lock is always present ( happy if someone can tell more about this ).
our update triggered two locks, one for the dml and one for the transaction.
column id1 of the dml references our table, which is object 14072. we locked one row in shared exclusive mode.
column id2 of the transaction lock references the sequence of the transaction ( v$transaction.xidsqn ). so, the other way around, you can check the locks for your session and from there get to the object and transaction.

in my case, the redo containing the update must be the current one ( as nothing else is happening on my database ). so i’ll find one copy of it ( as the logs are mirrored ):

select GROUP#
, THREAD#
, SEQUENCE#
, STATUS
from v$log;
GROUP# THREAD# SEQUENCE# STATUS
---------- ---------- ---------- ---------------
1 1 85 INACTIVE
2 1 86 INACTIVE
3 1 87 CURRENT
select member
from v$logfile
where group# = 3;
MEMBER
------------------------------------------------------------------------------------------------------------------------
+DB112_DATA_DG/db112/onlinelog/group_3.259.779116045
+DB112_ARCH_DG/db112/onlinelog/group_3.259.779116047

… dump the first one:

alter system dump logfile '+DB112_DATA_DG/db112/onlinelog/group_3.259.779116045';

… and you will find the redo record:

REDO RECORD - Thread:1 RBA: 0x000057.000000a2.0010 LEN: 0x01fc VLD: 0x0d
SCN: 0x0000.000ea149 SUBSCN: 1 04/24/2012 20:10:42
(LWN RBA: 0x000057.000000a2.0010 LEN: 0002 NST: 0001 SCN: 0x0000.000ea149)
CHANGE #1 TYP:2 CLS:1 AFN:4 DBA:0x0100017d OBJ:14072 SCN:0x0000.000ea0c2 SEQ:1 OP:11.19 ENC:0 RBL:0
KTB Redo
op: 0x11 ver: 0x01
compat bit: 4 (post-11) padding: 1
op: F xid: 0x0001.010.00000122 uba: 0x00c001e3.0036.0b
Block cleanout record, scn: 0x0000.000ea148 ver: 0x01 opt: 0x02, entries follow...
itli: 1 flg: 2 scn: 0x0000.000ea0c2
Array Update of 1 rows:
tabn: 0 slot: 0(0x0) flag: 0x2c lock: 2 ckix: 0
ncol: 1 nnew: 1 size: 0
KDO Op code: 21 row dependencies Disabled
xtype: XAxtype KDO_KDOM2 flags: 0x00000080 bdba: 0x0100017d hdba: 0x0100017a
itli: 2 ispac: 0 maxfr: 4858
vect = 0
col 0: [ 2] c1 03
CHANGE #2 TYP:0 CLS:17 AFN:3 DBA:0x00c00080 OBJ:4294967295 SCN:0x0000.000ea097 SEQ:1 OP:5.2 ENC:0 RBL:0
ktudh redo: slt: 0x0010 sqn: 0x00000122 flg: 0x0012 siz: 164 fbi: 0
uba: 0x00c001e3.0036.0b pxid: 0x0000.000.00000000
CHANGE #3 TYP:0 CLS:18 AFN:3 DBA:0x00c001e3 OBJ:4294967295 SCN:0x0000.000ea096 SEQ:2 OP:5.1 ENC:0 RBL:0
ktudb redo: siz: 164 spc: 6734 flg: 0x0012 seq: 0x0036 rec: 0x0b
xid: 0x0001.010.00000122
ktubl redo: slt: 16 rci: 0 opc: 11.1 [objn: 14072 objd: 14072 tsn: 4]
Undo type: Regular undo Begin trans Last buffer split: No
Temp Object: No
Tablespace Undo: No
0x00000000 prev ctl uba: 0x00c001e3.0036.09
prev ctl max cmt scn: 0x0000.000e4630 prev tx cmt scn: 0x0000.000e4631
txn start scn: 0x0000.000ea07f logon user: 42 prev brb: 12583394 prev bcl: 0 BuExt idx: 0 flg2: 0
KDO undo record:
KTB Redo
op: 0x03 ver: 0x01
compat bit: 4 (post-11) padding: 1
op: Z
Array Update of 1 rows:
tabn: 0 slot: 0(0x0) flag: 0x2c lock: 0 ckix: 0
ncol: 1 nnew: 1 size: 0
KDO Op code: 21 row dependencies Disabled
xtype: XAxtype KDO_KDOM2 flags: 0x00000080 bdba: 0x0100017d hdba: 0x0100017a
itli: 2 ispac: 0 maxfr: 4858
vect = 0
col 0: [ 2] c1 02

what can we see here:
1) there is our update “col 0: [ 2] c1 03”: change the first column of our table to 2 ( 03 – 1 ).
2) there is the same undo entry as in the undo block a little later in the trace: “col 0: [ 2] c1 02”.

why is there the same entry in the redo as we found it in the undo ? remember that we did not yet finish our transaction ( the commit is still pending ). so what will happen if the instance crashes now? when the instance comes up again after the crash oracle will scan the redo logs and apply all the changes that happened up to before the crash. and as we did not commit the transaction oracle must do a rollback, and that’s what the redo entry is about ( redo the undo ).

lets commit the update in the initial session and check what changed.

commit;

what happened to our transaction:

SELECT addr
, ubafil
, ubablk
, ubarec
, status
, xid
, start_scn
FROM v$transaction
WHERE ses_addr = '000000006F680A28';
no rows selected

as expected, the transaction finished.

our locks?

SELECT sid
, id1
, id2
, lmode
, request
FROM v$lock
WHERE sid = 32;
SID TYPE ID1 ID2 LMODE REQUEST
SID ID1 ID2 LMODE REQUEST
---------- ---------- ---------- ---------- ----------
32 100 0 4 0

gone, too.

the buffer headers ?

SELECT file#
, status
, dirty
, temp
, ping
, stale
, direct
, objd
, block#
FROM v$bh
WHERE objd = 14072
AND block# = 381;
FILE# STATUS DIRTY TEMP PING STALE DIREC OBJD BLOCK#
---------- --------------- ----- ----- ----- ----- ----- ------ -------
4 cr N N N N N 14072 381
4 xcur Y N N N N 14072 381

the dirty flag for our buffer changed to ‘Y’, so there was some modification. obvious, as we changed the row.

just for completion: if you do a rollback instead of the commit you’d get another redo entry describing the rollback.

again this is far from being complete but should give you some hints on what is happening behind the scenes. and, even more important: every change to the database is recorded in the log files ( and this includes undo generation ).

memory management

April 28, 2012 — Leave a comment

the performance of most applications depends on the efficiency that memory is managed by the operating system. because memory is not only used by applications but also by the kernel itself for storing its data and structures some portions of the memory are reserved by the kernel. the rest of the memory is called the dynamic memory.

memory gets addressed by the kernel in pages which are typically 4kb in size. you can check the pagesize in linux with the following command:

getconf PAGESIZE
4096

to track the status of all the pages there is a so called page descriptor. as pages may be used by several processes, the kernel itself or not used at all this descriptor contains the information the kernel needs when dealing with all the pages. one of the fields of the pages descriptor is called “lru” which stands for? same as in the oracle database: least recently used. the lru contains pointers to the least recently used double linked list of pages. remember: the same concepts, over and over again.

another fields describes the status of a page, which, for example, can be:

  • locked
  • dirty
  • active

note that oracle uses the word “dirty” in exactly the same manner: the page has been modified ( in oracle syntax it is a buffer )

when there is a request for allocating a page two things can happen:

  1. there is enough free space and the request is successful immediately
  2. before the allocation request may succeed some cleanup work must be done ( which usually blocks the request until finished ). you can compare this to the “buffer wait” events in oracle

because some critical requests can not be blocked there are exceptions to the second case ( for example when handling interrupts ). in these cases the request will be atomic and fail if no free pages are available. to minimize the chance for failing requests some pages are reserved by the kernel for these atomic requests. the amount of pages which will be reserved is calculated at system initialization and can be changed later by modifying a file in the proc filesystem:

cat /proc/sys/vm/min_free_kbytes
67584

oracle uses a similar concept for the shared_pool_reserved_size. this parameter defines some portion of the shared_pool to be reserved for large contiguous memory allocations. the goal is the same as with the linux kernel: try to block others as less as possible and make sure the allocation request succeeds.

as time goes by and requests for memory allocations come and go, memory will be allocated and released. this leads to a common issue with memory management: fragmentation. frequent allocations and releases may lead to situations that although there is enough free memory for a request the request will fail. this is because the remaining free memory is scattered through already allocated pages ( internal fragmentation ) or there is no free contiguous free memory that can satisfy the request ( external fragmentation ). and that is whats happening when you face the “ORA-04031: unable to allocate x bytes of shared memory” in the alertlog.

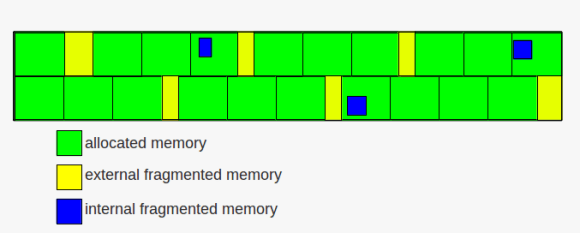
memory fragmentation

while internal fragmentation is waste of memory external fragmentation may lead to failing allocation requests. to avoid external fragmentation as much as possible the linux kernel groups the free pages into lists of 1,2,4,8,16,32,64,128,256,512 and 1024 contiguous chunks. if, for example, a request for 128 of contiguous memory page frames arrives the kernel will first check the 128 list for a free block. if a free block exists the memory gets allocated. if no free block exists in that list the next bigger list ( the 256 ) will be check for free blocks. if a free block exists there the kernel allocates 128 from the 256 page frames and inserts the remaining 128 page frames to the 128 list. this, if no free block is found in the next bigger list, will continue until the last group is reached ( the 1024 list ) and if this list is empty an error will be signaled.
the other way around the kernel tries to merge free blocks into bigger blocks when memory is released ( if the blocks have the same size and are located next to each other ).

there is much more to say about memory management ( e.g. slabs ), but this will be a topic for another post ….

until now we had an introduction to processes, how they are managed, what signals are and what they are used for, how the linux kernel ( and oracle ) uses double linked list to quickly look up memory structures and how critical regions like shared memory can be protected. this post gives an introduction to timing and process scheduling.

as the cpu can execute only one process at a time but because maybe hundreds or thousands of processes want to do their work the kernel must provide a mechanism to decide which process to run next ( process switching ). this is the task of the scheduler. for being able to do what it does, the scheduler must be able to make decisions, and the decisions are based on time and priorities.

lots and lots of work behind the scenes is driven by time measurements. consider cronjobs, for example. without being able to measure time they would not work. in short the kernel must be able to keep the current time and to provide a mechanism to notify programs when a specific interval has elapsed.

on the one hand there is the real time clock ( accessible through the /dev/rtc interface ) which is a special chip that continues to tick even if the computer is powered off ( there is a small battery for this chip ). the real time clock is used by linux to derive the date and time.

on the other hand there are several other mechanisms which can be used for timing:

one of the time related activities the kernel must perform is to determine how long a process has been running. each process is given a time slot in which it may run, which is called a quanta. if the quantum expires and the process did not terminate a process switch may occur ( another process is selected for execution ). these processes are called expired. active processes are those which did not yet consume their quantum.
additionally each process has a priority assigned, which is used by the scheduler to decide how appropriate it is to let the process do its work on the cpu.

in general processes can be divided in three classes:

  • interactive: typical interactive processes are those which respond to keyboard and mouse inputs of an end user. as an user wants to see quick responses, for example when editing text, these processes must be woken up quickly
  • batch: batch processes do not interact with the user and often run in the background.
  • real-time: real-time processes have very strong scheduling requirements and should not be blocked by processes with lower priorities.

in general the scheduler will give more attention to interactive processes than to batch processes, although this must not always be true.

one way we can change the base priority of processes from the command line is by using the “nice” command:

nice -19 vi

if you check the process without the nice call:

ps -aux | grep vi
oracle 4185 0.5 0.0 5400 1504 pts/0 S+ 10:51 0:00 vi

… and compare it to when you call vi with a nice value:

ps -aux | grep vi
oracle 4194 1.6 0.0 5400 1496 pts/0 SN+ 10:52 0:00 vi

.. you will see that “S+” changes to “SN+” ( the “N” stands for “low-priority (nice to other users)”

processes in linux are preemptable, which means that higher priority processes may suspend lower priority processes when they enter the running state. another reason a process can be preempted is when its time quantum expires.

consider this example: a user is writing an email while copying music from a cd to her computer. the email client is considered an interactive program while the copy job is considered a batch program. each time the user presses a key on her keyboard an interrupt occurs and the scheduler selects the email program for execution. but because users tend to think when writing emails there is plenty of time ( regarding the cpu ) between the key presses to wake up the copy job and let it do its work.

the time a process is allowed to be on a cpu, the quantum, is derived from a so called “static priority” which can be in the range of 100 to 139 ( with 100 being the highest priority and 139 being the lowest ). the higher the priority the more time the process is granted ( which ranges from 800ms for the highest priority to 5ms for the lowest priority ). in addition to the static priority there is a “dynamic priority” for each process ( again ranging from 100 to 139 ). without going too much into detail again: the dynamic priority is the one the scheduler uses for its decisions. as the name suggest, this priority may change over time ( depending on the average sleep time of a process ). processes with longer sleep times usually get a bonus ( the priority will be increased ) while processes with lower sleep times will get a penalty ( the priority will be decreased ). the average sleep time is also used by the scheduler to decide if processes are interactive or batch.

recall the post about double linked lists. the most important data structure used by the scheduler is the runqueue, which in fact is another linked list. this list links together all the process descriptors of the processes which want to run ( there is one runqueue per cpu ). one process can be in one runqueue only, but processes may migrate to others runqueues if the load between the cpus becomes unbalanced.

what to keep in mind: as only one process can run on one cpu at a time the scheduler decides which process to run next and which processes to suspend in case higher priority processes enter the running state. in general interactive processes are favored over batch processes and real-time processes should not be blocked by lower priority processes.

as mentioned in the previous post about semaphores there are more things to consider when it comes to interprocess communication. as semaphores are used to protect critical regions, there must be some critical regions to protect and this is the shared memory oracle uses for its communication.

to give an example on how the shared memory addressing works we will take a look at what happens when the database starts up.
for this you’ll need two sessions to a test infrastructure ( one as the database owner, the other as root ).

session one ( oracle ):
connect to sqlplus as sysdba make sure you shutdown the database ( do not exit sqlplus once the database is down ):

sqlplus / as sysdba
shutdown immediate

session two ( root ): discover the PID for then sqlplus session above …

ps -ef | grep sqlp
oracle    3062  3036  0 09:49 pts/1    00:00:00 sqlplus

… check the shared memory segments and trace the sqlplus PID from above:

ipcs -m
------ Shared Memory Segments --------
key        shmid      owner      perms      bytes      nattch     status      
0x7401003e 1310720    root      600        4          0                       
0x74010014 1998849    root      600        4          0                       
0x00000000 2359298    root      644        80         2                       
0x74010013 1966083    root      600        4          0                       
0x00000000 2392068    root      644        16384      2                       
0x00000000 2424837    root      644        280        2                       
0x00000000 2490374    grid      640        4096       0                       
0x00000000 2523143    grid      640        4096       0                       
0x8e11371c 2555912    grid      640        4096       0
# start the trace
strace -o db_startup.log -fp 3062

it is important to specify the “-f” flag for the strace call. this will tell strace to follow the child processes spawned.

in session one startup the database…

startup

… and stop the tracing in the root session once the database is up and re-check the shared memory segments.

ipcs -m
------ Shared Memory Segments --------
key        shmid      owner      perms      bytes      nattch     status      
0x7401003e 1310720    root      600        4          0                       
0x74010014 1998849    root      600        4          0                       
0x00000000 2359298    root      644        80         2                       
0x74010013 1966083    root      600        4          0                       
0x00000000 2392068    root      644        16384      2                       
0x00000000 2424837    root      644        280        2                       
0x00000000 2490374    grid      640        4096       0                       
0x00000000 2523143    grid      640        4096       0                       
0x8e11371c 2555912    grid      640        4096       0                       
0x00000000 3538953    oracle    640        4096       0                       
0x00000000 3571722    oracle    640        4096       0                       
0x3393b3a4 3604491    oracle    640        4096       0

as you can see, three more segments appeared after the database started up.

you’ll probably noticed some trace output on the screen similar to this:

Process 3468 detached
Process 3470 attached (waiting for parent)
Process 3470 resumed (parent 3409 ready)
Process 3471 attached (waiting for parent)
Process 3471 resumed (parent 3470 ready)
Process 3469 detached
Process 3470 detached

this is because of the “-f” flag given to strace.
the complete trace output is now available in the db_startup.log trace file and we are ready to take a look at it.

the first thing that catches the eye are the various references to the “/proc” filesystem. in may trace file there are 1213 calls to it. you can check this with:

grep "/proc/" db_startup.log | wc -l

take a look at the previous post which introduces the “/proc” filesystem for more information. for the scope of this post just notice how much depends on it.

the actual startup of the database is triggered by the following line:

execve("/opt/oracle/product/base/11.2.0.3/bin/oracle", ["oracleDB112", "(DESCRIPTION=(LOCAL=YES)(ADDRESS"], [/* 22 vars */]) = 0

this is the call to the oracle binary ( execve executes the binary ) with 22 arguments omitted. from now on the oracle instance starts up.

the calls important to the shared memory stuff are the following:

  • brk: changes a data segment’s size
  • mmap, munmap: maps/unmaps files or devices into memory
  • mprotect: sets protection on a region of memory
  • shmget: allocates a shared memory segment
  • shmat, shmdt: performs attach/detach operations on shared memory
  • get_mempolicy: return NUMA memory policies for a process
  • semget: get a semaphore identifier
  • semctl: perform control operations on a semaphore
  • semop, semtimedop: perform sempahore operations

for each of the above commands you can check the man-pages for more information.
as the trace file is rather large and a lot of things are happening i will focus on the minimum ( this is not about re-engineering oracle :) ):

let’s check the keys returned by the ipcs command above:

egrep "3538953|3571722|3604491" db_startup.log
...
5365  shmget(IPC_PRIVATE, 4096, IPC_CREAT|IPC_EXCL|0640) = 3538953
5365  shmget(IPC_PRIVATE, 4096, IPC_CREAT|IPC_EXCL|0640) = 3571722
5365  shmget(0x3393b3a4, 4096, IPC_CREAT|IPC_EXCL|0640) = 3604491
...

as you can see the identifiers returned by the shmget call ( 3604491,3571722,3538953 ) correspond to the ones reported by ipcs. you wonder about the size of 4096 bytes ? this is because memory_target/memory_max_target is in use by the instance. if the database is configured using sga_target/sga_max_target you would see the actual size. let’s check this:

su - oracle
sqlplus / as sysdba
alter system reset memory_max_target scope=spfile;
alter system reset memory_target scope=spfile;
alter system set sga_max_size=256m scope=spfile;
alter system set sga_target=256m scope=spfile;
alter system set pga_aggregate_target=24m scope=spfile;
startup force;
exit;
# re-check the shared memory segments
ipcs -m
------ Shared Memory Segments --------
key        shmid      owner      perms      bytes      nattch     status      
0x00000000 2359298    root      644        80         2                       
0x00000000 2392068    root      644        16384      2                       
0x00000000 2424837    root      644        280        2                       
0x00000000 2490374    grid      640        4096       0                       
0x00000000 2523143    grid      640        4096       0                       
0x8e11371c 2555912    grid      640        4096       0                       
0x00000000 3801097    oracle    640        8388608    25                      
0x00000000 3833866    oracle    640        260046848  25                      
0x3393b3a4 3866635    oracle    640        2097152    25

the “260046848” corresponds to the sga size of 256m and the nattch column shows that 25 processes are attached to it. you can double check the 25
attached processes if you want:

ps -ef | grep DB112 | grep -v LISTENER | grep -v grep | wc -l

let’s return to the memory_target/memory_max_target configuration. as oracle puts together all the memory junks ( pga and sga ) the management of memory changes to the virtual shared memory filesystem ( tmpfs ). unfortunately this is not visible with the ipcs command.
but you can map your memory_* sizes to the shm filesystem:

ls -la /dev/shm/ | grep -v "+ASM"
total 466100
drwxrwxrwt  2 root   root        2640 Apr 10 13:09 .
drwxr-xr-x 10 root   root        3400 Apr 10 09:44 ..
-rw-r-----  1 oracle asmadmin 4194304 Apr 10 13:27 ora_DB112_3932169_0
-rw-r-----  1 oracle asmadmin 4194304 Apr 10 13:09 ora_DB112_3932169_1
-rw-r-----  1 oracle asmadmin 4194304 Apr 10 13:09 ora_DB112_3964938_0
-rw-r-----  1 oracle asmadmin 4194304 Apr 10 13:20 ora_DB112_3964938_1
-rw-r-----  1 oracle asmadmin 4194304 Apr 10 13:09 ora_DB112_3964938_10
-rw-r-----  1 oracle asmadmin 4194304 Apr 10 13:20 ora_DB112_3964938_11
-rw-r-----  1 oracle asmadmin 4194304 Apr 10 13:10 ora_DB112_3964938_12

note that i have excluded the ASM stuff here. in my case each segment ( or granule ) is 4mb of size ( this depends on the avaible memory of the system ) and the sum of all the segments should get you near to your memory_* configuration.

as ipcs can not tell you much here there are other commands to use. if you want to know which process has a memory granule open:

fuser -v /dev/shm/ora_DB112_4358154_49
                     USER        PID ACCESS COMMAND
/dev/shm/ora_DB112_4358154_49:
                     oracle     6626 ....m oracle
                     oracle     6628 ....m oracle
                     oracle     6630 ....m oracle
                     oracle     6634 ....m oracle
                     oracle     6636 ....m oracle
                     oracle     6638 ....m oracle
                     oracle     6640 ....m oracle
                     oracle     6642 ....m oracle
                     oracle     6644 ....m oracle
                     oracle     6646 ....m oracle
                     oracle     6648 ....m oracle
                     oracle     6650 ....m oracle
                     oracle     6652 ....m oracle
                     oracle     6654 ....m oracle
                     oracle     6656 ....m oracle
                     oracle     6658 ....m oracle
                     oracle     6662 ....m oracle
                     oracle     6669 ....m oracle
                     oracle     6744 ....m oracle
                     oracle     6767 ....m oracle
                     oracle     6769 ....m oracle
                     oracle     6791 ....m oracle
                     oracle     7034 ....m oracle

or the other way around, if you want to know which files are opened by a specific process:

ps -ef | grep pmon | grep -v "ASM"
oracle    6626     1  0 13:40 ?        00:00:05 ora_pmon_DB112
root      7075  5338  0 14:33 pts/0    00:00:00 grep pmon
# use the pmap command on the PID
pmap 6626
6626:   ora_pmon_DB112
0000000000400000 183436K r-x--  /opt/oracle/product/base/11.2.0.3/bin/oracle
000000000b922000   1884K rwx--  /opt/oracle/product/base/11.2.0.3/bin/oracle
000000000baf9000    304K rwx--    [ anon ]
0000000010c81000    660K rwx--    [ anon ]
0000000060000000      4K r-xs-  /dev/shm/ora_DB112_4325385_0
0000000060001000   4092K rwxs-  /dev/shm/ora_DB112_4325385_0
0000000060400000   4096K rwxs-  /dev/shm/ora_DB112_4325385_1
0000000060800000   4096K rwxs-  /dev/shm/ora_DB112_4358154_0
0000000060c00000   4096K rwxs-  /dev/shm/ora_DB112_4358154_1
0000000061000000   4096K rwxs-  /dev/shm/ora_DB112_4358154_2
0000000061400000   4096K rwxs-  /dev/shm/ora_DB112_4358154_3
0000000061800000   4096K rwxs-  /dev/shm/ora_DB112_4358154_4
0000000061c00000   4096K rwxs-  /dev/shm/ora_DB112_4358154_5
0000000062000000   4096K rwxs-  /dev/shm/ora_DB112_4358154_6
...

if you have troubles starting up your instance with this configuration ( ORA-00845 ) check the size of the virtual filesystem:

df -h
Filesystem            Size  Used Avail Use% Mounted on
/dev/hdc1              28G   14G   12G  54% /
tmpfs                 741M  456M  286M  62% /dev/shm

depending on your configuration ( memory_* or sga_* parameters ) the way that memory is managed changes ( from System V to POSIX, to be exact ).

lots and lots of information. not all of it is important to keep in mind. but what you should remember:
there are several processes and memory segments that make up the oracle instance. as several processes are attached to the same memory regions there must be a way to protect them from concurrent access ( think of semaphores ) … and oracle heavily depends on shared memory. if you scroll through the trace file you’ll notice that there are thousands of operations going on when an oracle instance starts up. imagine what is going on if the instance is under heavy workload and lots and lots of things need protection.

ps: for those interested:

there is plenty of more interesting stuff which you can find in the db_startup.log trace, for example:

writing the audit files:

grep -i adump db_startup.log  | grep -v ASM
3404  open("/oradata/DB112/admin/adump/DB112_ora_3404_2.aud", O_RDWR|O_CREAT|O_EXCL, 0660) = 10
3404  write(10, "/oradata/DB112/admin/adump/DB112"..., 47) = 47
3444  open("/oradata/DB112/admin/adump/DB112_ora_3444_1.aud", O_RDWR|O_CREAT|O_EXCL, 0660) = -1 EEXIST (File exists)
3444  open("/oradata/DB112/admin/adump/DB112_ora_3444_2.aud", O_RDWR|O_CREAT|O_EXCL, 0660) = 8
3444  write(8, "/oradata/DB112/admin/adump/DB112"..., 47) = 47
3481  open("/oradata/DB112/admin/adump/DB112_ora_3481_1.aud", O_RDWR|O_CREAT|O_EXCL, 0660 
3481  write(8, "/oradata/DB112/admin/adump/DB112"..., 47) = 47

writing the alert.log:

grep -i "alert_DB112.log" db_startup.log
3404  lstat("/oradata/DB112/admin/diag/rdbms/db112/DB112/trace/alert_DB112.log", {st_mode=S_IFREG|0640, st_size=110201, ...}) = 0
3404  open("/oradata/DB112/admin/diag/rdbms/db112/DB112/trace/alert_DB112.log", O_WRONLY|O_CREAT|O_APPEND, 0660) = 5
3404  lstat("/oradata/DB112/admin/diag/rdbms/db112/DB112/trace/alert_DB112.log", {st_mode=S_IFREG|0640, st_size=110260, ...}) = 0
3404  open("/oradata/DB112/admin/diag/rdbms/db112/DB112/trace/alert_DB112.log", O_WRONLY|O_CREAT|O_APPEND, 0660) = 11

reading the oracle message files:

grep msb db_startup.log
db_startup.log:5438  open("/opt/oracle/product/base/11.2.0.3/oracore/mesg/lrmus.msb", O_RDONLY) = 18
db_startup.log:5430  open("/opt/oracle/product/base/11.2.0.3/rdbms/mesg/oraus.msb", O_RDONLY 
db_startup.log:5494  open("/opt/oracle/product/base/11.2.0.3/rdbms/mesg/oraus.msb", O_RDONLY

getting sempahores:

grep semget db_startup.log 
5365  semget(IPC_PRIVATE, 1, IPC_CREAT|IPC_EXCL|0600) = 1081346
5365  semget(IPC_PRIVATE, 124, IPC_CREAT|IPC_EXCL|0666) = 1114114
5365  semget(IPC_PRIVATE, 124, IPC_CREAT|0660) = 1146882
5365  semget(0x710dfe10, 0, 0)          = -1 ENOENT (No such file or directory)
5365  semget(0x46db3f80, 0, 0)          = -1 ENOENT (No such file or directory)
5365  semget(0x9ae46084, 0, 0)          = -1 ENOENT (No such file or directory)
5365  semget(0xf6dcc368, 0, 0)          = -1 ENOENT (No such file or directory)
5365  semget(0x710dfe10, 124, IPC_CREAT|IPC_EXCL|0640) = 1179650

some exadata stuff:

3404  open("/etc/oracle/cell/network-config/cellinit.ora", O_RDONLY) = -1 ENOENT (No such file or directory)

and … and …

if you followed the oracle installation guide there are some kernel parameters to be configured for the oracle database. one of them specified by four values is about semaphores:

  • semmsl: the maximum number of semaphores per semaphore set
  • semmns: the maximum number of semaphore of the entire system
  • semopm: number of maximum operations per semop call
  • semmni: the maximum number of semaphore sets of the entire system

the question is: what are these semaphores about and what are they for?


a semaphore is a counter associated with a data structure which provides locking and synchronization of critical regions. there is one semaphore ( initialized to 1 ) for each data structure to be protected. the atomic methods “down” and “up” are used to decrease and increase the counter. if the kernel wants access to a protected structure it executes the “down” method and if the result is not negative ( the counter is equal or greater than zero ) access to the resource is granted. if the counter is negative the process which wishes to access the resource is blocked and added to the sempahore list ( a kind of queue ). as time goes by some process finishes its work and executes the “up” method which allows one process in the semaphore list to proceed.

in linux there are two kinds of semaphores:

  • kernel semaphores ( for kernel control paths )
  • system V IPC semaphores ( for user mode processes ), IPC stands for “interprocess communication”

the IPC semaphores are the ones relevant to the oracle database. semaphores are created by the function semget() which returns the semaphore identifier. there are two other functions for creating ipc resources, which are:

  • msgget(): which is for message queues
  • shmget(): which is for shared memory

there must be at least one semaphore for each oracle process ( the processes parameter of the database ). as each session to the database needs to be synchronized with other sessions ( and sessions are memory structures ) oracle must request resources from the operation system to be able to handle concurrency in the sga to which all sessions are connected to.

the semaphores queue of pending requests is implemented as a double linked list. you remember? the same concepts over and over again. actually semaphores are sometimes called mutexes ( and there are internal functions like init_MUTEX )… surprised ?

to display the current limits the following command can be used:

ipcs -ls
------ Semaphore Limits --------
max number of arrays = 1024
max semaphores per array = 250
max semaphores system wide = 32000
max ops per semop call = 32
semaphore max value = 32767

or you can directly query the /proc filesystem:

cat /proc/sys/kernel/sem
250 32000 32 1024

to check the currently allocated semaphores:

ipcs -s
------ Semaphore Arrays --------
key semid owner perms nsems
0x127f81f8 163842 oracle 640 124
0x3d2c0d44 1933315 oracle 640 129
0x3d2c0d45 1966084 oracle 640 129
0x3d2c0d46 1998853 oracle 640 129
0x3d2c0d47 2031622 oracle 640 129
0x3d2c0d48 2064391 oracle 640 129

if you want to see some semaphore operations in action do, for example, a strace on the smon process and wait one or two seconds:

ps -ef | grep dbw
oracle 2723 1 0 08:31 ? 00:00:03 ora_smon_dbs300
root 3153 3111 2 09:04 pts/1 00:00:00 grep smon
strace -p 2723
...
semtimedop(819203, {{17, -1, 0}}, 1, {3, 0}) = -1 EAGAIN (Resource temporarily unavailable)
gettimeofday({1333697562, 861932}, NULL) = 0
semtimedop(819203, {{17, -1, 0}}, 1, {3, 0}) = -1 EAGAIN (Resource temporarily unavailable)
gettimeofday({1333697565, 871767}, NULL) = 0
semtimedop(819203, {{17, -1, 0}}, 1, {3, 0}) = -1 EAGAIN (Resource temporarily unavailable)
gettimeofday({1333697568, 893455}, NULL) = 0
semtimedop(819203, {{17, -1, 0}}, 1, {3, 0}) = -1 EAGAIN (Resource temporarily unavailable)
gettimeofday({1333697571, 905050}, NULL) = 0
semtimedop(819203, {{17, -1, 0}}, 1, {3, 0}) = -1 EAGAIN (Resource temporarily unavailable)
gettimeofday({1333697574, 920094}, NULL) = 0
...

here you can clearly see calls to semtimedop which return with -1 ( EAGAIN, the call expired ).

if you followed the series on how to setup a test infrastructure or you have a test infrastructure available to play with here is a little demonstration:

be sure to save your current kernel semaphore settings:

cat /proc/sys/kernel/sem
250 32000 32 1024

minimize the settings to very low values and try to restart ( or start ) the oracle instance:

su-
echo "2 10 1 2" > /proc/sys/kernel/sem

if you write the values to the /proc/sys/kernel/…-parameter files the values will be in effect immediately. be sure what you are doing if you’re touching these parameters.

startup or restart the oracle instance:

su - oracle
sqlplus / as sysdba
startup force
ORA-27154: post/wait create failed
ORA-27300: OS system dependent operation:semget failed with status: 28
ORA-27301: OS failure message: No space left on device
ORA-27302: failure occurred at: sskgpbitsper

what happened ? the database was not able to allocate the resources ( sempahores ) it needs, thus can not start up. the message “No space left on device” indicates some issue with disk space, but it’s actually the memory in question here. fyi: the allocation of semaphores ( and shared memory ) does only occur during the “startup nomount” phase. this is the only time oracle requests this resources.

fix it, and try again:

su -
echo "250 32000 32 1024" > /proc/sys/kernel/sem
su - oracle
startup force

conclusion: semaphores are one critical part for interprocess communication and provide a way for locking and synchronization. if the database can not allocate the resources it needs from the operating system it will fail to start up.

the values recommended in the installation guides are minimum values. if your session count to the database grows you may need to adjust the semaphore parameters.