
there is a very old critical security hole regarding the oracle database. be aware of it, as there is no fix for it currently:
Archives For March 31, 2012
the performance of most applications depends on the efficiency that memory is managed by the operating system. because memory is not only used by applications but also by the kernel itself for storing its data and structures some portions of the memory are reserved by the kernel. the rest of the memory is called the dynamic memory.
memory gets addressed by the kernel in pages which are typically 4kb in size. you can check the pagesize in linux with the following command:
getconf PAGESIZE
4096
to track the status of all the pages there is a so called page descriptor. as pages may be used by several processes, the kernel itself or not used at all this descriptor contains the information the kernel needs when dealing with all the pages. one of the fields of the pages descriptor is called “lru” which stands for? same as in the oracle database: least recently used. the lru contains pointers to the least recently used double linked list of pages. remember: the same concepts, over and over again.
another fields describes the status of a page, which, for example, can be:
- locked
- dirty
- active
- …
note that oracle uses the word “dirty” in exactly the same manner: the page has been modified ( in oracle syntax it is a buffer )
when there is a request for allocating a page two things can happen:
- there is enough free space and the request is successful immediately
- before the allocation request may succeed some cleanup work must be done ( which usually blocks the request until finished ). you can compare this to the “buffer wait” events in oracle
because some critical requests can not be blocked there are exceptions to the second case ( for example when handling interrupts ). in these cases the request will be atomic and fail if no free pages are available. to minimize the chance for failing requests some pages are reserved by the kernel for these atomic requests. the amount of pages which will be reserved is calculated at system initialization and can be changed later by modifying a file in the proc filesystem:
cat /proc/sys/vm/min_free_kbytes
67584
oracle uses a similar concept for the shared_pool_reserved_size. this parameter defines some portion of the shared_pool to be reserved for large contiguous memory allocations. the goal is the same as with the linux kernel: try to block others as less as possible and make sure the allocation request succeeds.
as time goes by and requests for memory allocations come and go, memory will be allocated and released. this leads to a common issue with memory management: fragmentation. frequent allocations and releases may lead to situations that although there is enough free memory for a request the request will fail. this is because the remaining free memory is scattered through already allocated pages ( internal fragmentation ) or there is no free contiguous free memory that can satisfy the request ( external fragmentation ). and that is whats happening when you face the “ORA-04031: unable to allocate x bytes of shared memory” in the alertlog.
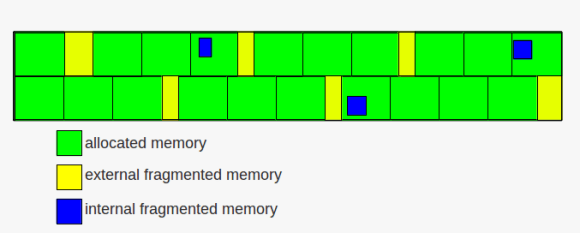 memory fragmentation
while internal fragmentation is waste of memory external fragmentation may lead to failing allocation requests. to avoid external fragmentation as much as possible the linux kernel groups the free pages into lists of 1,2,4,8,16,32,64,128,256,512 and 1024 contiguous chunks. if, for example, a request for 128 of contiguous memory page frames arrives the kernel will first check the 128 list for a free block. if a free block exists the memory gets allocated. if no free block exists in that list the next bigger list ( the 256 ) will be check for free blocks. if a free block exists there the kernel allocates 128 from the 256 page frames and inserts the remaining 128 page frames to the 128 list. this, if no free block is found in the next bigger list, will continue until the last group is reached ( the 1024 list ) and if this list is empty an error will be signaled.
the other way around the kernel tries to merge free blocks into bigger blocks when memory is released ( if the blocks have the same size and are located next to each other ).
there is much more to say about memory management ( e.g. slabs ), but this will be a topic for another post ….

if you ever wondered where oracle stores the statistic preferences one can set by using the dbms_stats.set_*_prefs procedures here you go:
global statistic preferences
table which holds the values: sys.optstat_hist_control$
example script to query the settings:
COLUMN SNAME FOR a30;
COLUMN SVAL1 FOR 9999;
COLUMN SVAL2 FOR a20;
COLUMN SPARE1 FOR 999999;
COLUMN SPARE2 FOR 999;
COLUMN SPARE3 FOR 999999;
COLUMN SPARE4 FOR a30;
COLUMN SPARE5 FOR a10;
COLUMN SPARE6 FOR a10;
SELECT sname
, sval1
, to_char(sval2,'DD.MM.YYYY HH24:MI:SS') sval2
, spare1
, spare2
, spare3
, spare4
, spare5
, spare6
FROM sys.optstat_hist_control$
ORDER BY 1
;
procedure which affects the table: dbms_stats.set_global_prefs, e.g.:
exec dbms_stats.set_global_prefs ( 'ESTIMATE_PERCENT', '11');
non-global ( user ) statistic preferences
table which holds the values: sys.optstat_user_prefs$
example script to query the settings:
COLUMN owner FOR a20;
COLUMN object_name FOR a20;
COLUMN object_type FOR a20;
COLUMN pname FOR a30;
COLUMN valnum FOR 99999;
COLUMN valchar FOR a30;
COLUMN chgtime FOR a20;
COLUMN spare1 FOR 999;
SELECT do.owner
, do.object_name
, do.object_type
, o.pname
, o.valnum
, o.valchar
, to_char(o.chgtime,'DD.MM.YYYY HH24:MI:SS') chgtime
, o.spare1
FROM sys.optstat_user_prefs$ o
, dba_objects do
WHERE o.obj# = do.object_id
;
procedures which affects the table: dbms_stats.set_global_prefs, dbms_stats.set_schema_prefs, dbms_stats.set_database_prefs,e.g.:
exec dbms_stats.set_table_prefs ( USER,'T1','GRANULARITY','ALL');
exec dbms_stats.set_schema_prefs ( USER,'ESTIMATE_PERCENT','11' );
exec dbms_stats.set_database_prefs ( 'ESTIMATE_PERCENT', '12', FALSE );
until now we had an introduction to processes, how they are managed, what signals are and what they are used for, how the linux kernel ( and oracle ) uses double linked list to quickly look up memory structures and how critical regions like shared memory can be protected. this post gives an introduction to timing and process scheduling.
as the cpu can execute only one process at a time but because maybe hundreds or thousands of processes want to do their work the kernel must provide a mechanism to decide which process to run next ( process switching ). this is the task of the scheduler. for being able to do what it does, the scheduler must be able to make decisions, and the decisions are based on time and priorities.
lots and lots of work behind the scenes is driven by time measurements. consider cronjobs, for example. without being able to measure time they would not work. in short the kernel must be able to keep the current time and to provide a mechanism to notify programs when a specific interval has elapsed.
on the one hand there is the real time clock ( accessible through the /dev/rtc interface ) which is a special chip that continues to tick even if the computer is powered off ( there is a small battery for this chip ). the real time clock is used by linux to derive the date and time.
on the other hand there are several other mechanisms which can be used for timing:
- time stamp counter
- programmable interval timer
- cpu local timer
- high precision event timer
- acpi power management timer
one of the time related activities the kernel must perform is to determine how long a process has been running. each process is given a time slot in which it may run, which is called a quanta. if the quantum expires and the process did not terminate a process switch may occur ( another process is selected for execution ). these processes are called expired. active processes are those which did not yet consume their quantum.
additionally each process has a priority assigned, which is used by the scheduler to decide how appropriate it is to let the process do its work on the cpu.
in general processes can be divided in three classes:
- interactive: typical interactive processes are those which respond to keyboard and mouse inputs of an end user. as an user wants to see quick responses, for example when editing text, these processes must be woken up quickly
- batch: batch processes do not interact with the user and often run in the background.
- real-time: real-time processes have very strong scheduling requirements and should not be blocked by processes with lower priorities.
in general the scheduler will give more attention to interactive processes than to batch processes, although this must not always be true.
one way we can change the base priority of processes from the command line is by using the “nice” command:
nice -19 vi
if you check the process without the nice call:
ps -aux | grep vi
oracle 4185 0.5 0.0 5400 1504 pts/0 S+ 10:51 0:00 vi
… and compare it to when you call vi with a nice value:
ps -aux | grep vi
oracle 4194 1.6 0.0 5400 1496 pts/0 SN+ 10:52 0:00 vi
.. you will see that “S+” changes to “SN+” ( the “N” stands for “low-priority (nice to other users)”
processes in linux are preemptable, which means that higher priority processes may suspend lower priority processes when they enter the running state. another reason a process can be preempted is when its time quantum expires.
consider this example: a user is writing an email while copying music from a cd to her computer. the email client is considered an interactive program while the copy job is considered a batch program. each time the user presses a key on her keyboard an interrupt occurs and the scheduler selects the email program for execution. but because users tend to think when writing emails there is plenty of time ( regarding the cpu ) between the key presses to wake up the copy job and let it do its work.
the time a process is allowed to be on a cpu, the quantum, is derived from a so called “static priority” which can be in the range of 100 to 139 ( with 100 being the highest priority and 139 being the lowest ). the higher the priority the more time the process is granted ( which ranges from 800ms for the highest priority to 5ms for the lowest priority ). in addition to the static priority there is a “dynamic priority” for each process ( again ranging from 100 to 139 ). without going too much into detail again: the dynamic priority is the one the scheduler uses for its decisions. as the name suggest, this priority may change over time ( depending on the average sleep time of a process ). processes with longer sleep times usually get a bonus ( the priority will be increased ) while processes with lower sleep times will get a penalty ( the priority will be decreased ). the average sleep time is also used by the scheduler to decide if processes are interactive or batch.
recall the post about double linked lists. the most important data structure used by the scheduler is the runqueue, which in fact is another linked list. this list links together all the process descriptors of the processes which want to run ( there is one runqueue per cpu ). one process can be in one runqueue only, but processes may migrate to others runqueues if the load between the cpus becomes unbalanced.
what to keep in mind: as only one process can run on one cpu at a time the scheduler decides which process to run next and which processes to suspend in case higher priority processes enter the running state. in general interactive processes are favored over batch processes and real-time processes should not be blocked by lower priority processes.
the previous post about SIGSEGV and the ORA-07445 introduced signals and how they are used by the kernel to notify processes about events.
many times I see people using the “kill -9” to terminate processes. no questions, this works most of the time, but a lot of people are not aware what they are actually doing when firing this command. in my opinion, kill is a really bad name for this command, because what kill is doing is not necessarily kill processes, but send signals to processes ( of which 9, or SIGKILL is probably the most well known ). a much better name, for example, would be “sig” or “signal”.
the list of signals one can use in regards to kill can be printed with:
kill -l
1) SIGHUP 2) SIGINT 3) SIGQUIT 4) SIGILL
5) SIGTRAP 6) SIGABRT 7) SIGBUS 8) SIGFPE
9) SIGKILL 10) SIGUSR1 11) SIGSEGV 12) SIGUSR2
13) SIGPIPE 14) SIGALRM 15) SIGTERM 16) SIGSTKFLT
17) SIGCHLD 18) SIGCONT 19) SIGSTOP 20) SIGTSTP
21) SIGTTIN 22) SIGTTOU 23) SIGURG 24) SIGXCPU
25) SIGXFSZ 26) SIGVTALRM 27) SIGPROF 28) SIGWINCH
29) SIGIO 30) SIGPWR 31) SIGSYS 34) SIGRTMIN
35) SIGRTMIN+1 36) SIGRTMIN+2 37) SIGRTMIN+3 38) SIGRTMIN+4
39) SIGRTMIN+5 40) SIGRTMIN+6 41) SIGRTMIN+7 42) SIGRTMIN+8
43) SIGRTMIN+9 44) SIGRTMIN+10 45) SIGRTMIN+11 46) SIGRTMIN+12
47) SIGRTMIN+13 48) SIGRTMIN+14 49) SIGRTMIN+15 50) SIGRTMAX-14
51) SIGRTMAX-13 52) SIGRTMAX-12 53) SIGRTMAX-11 54) SIGRTMAX-10
55) SIGRTMAX-9 56) SIGRTMAX-8 57) SIGRTMAX-7 58) SIGRTMAX-6
59) SIGRTMAX-5 60) SIGRTMAX-4 61) SIGRTMAX-3 62) SIGRTMAX-2
63) SIGRTMAX-1 64) SIGRTMAX
here you can see, what 9 really means, it is SIGKILL. the ( perhaps ) dangerous about SIGKILL is, that the process will not be allowed to do any cleanup ( for example releasing resources ). as this signal can not be ignored or caught, the process will terminate immediately ( you can compare it to the “shutdown abort” command of the oracle database ).
the way one should terminate processes is to use the SIGTERM (15) signal, the default parameter for kill. this allows the process to do its cleanup work and to safely terminate ( although this is dependent on how the process or the applications handles the signal ).
once interesting thing you can do by sending a signal to a process with kill is to force, for example, the ssh daemon to re-read its configuration without closing the active ssh sessions. you can try this with:
kill -HUP [PID_OF_SSHD]
be aware that this must not be true for other daemons, as this depends on how the program was implemented. the default behavior for SIGHUP ( hang up ) is abnormal termination. originally the SIGHUP comes from serial connections ( e.g. modems ) which indeed did a hang up when the user closed the connection.
closing the loop to the previous post about SIGSEGV and the ORA-07445 you can force an ORA-07445 by sending the SIGSEGV signal, for example, to the dbwriter process ( I hope there is no need to say: you should not try this on a production system ):
ps -ef | grep dbw
oracle 4560 1 0 13:18 ? 00:00:00 ora_dbw0_DB112
kill -11 4560
…which will result in the following errors reported in the alertlog:
Exception [type: SIGSEGV, unknown code] [ADDR:0xC41] [PC:0x32E7CD46BA, semtimedop()+10] [exception issued by pid: 3137, uid: 0] [flags: 0x0, count: 1]
Errors in file /oradata/DB112/admin/diag/rdbms/db112/DB112/trace/DB112_dbw0_4560.trc (incident=26003):
ORA-07445: exception encountered: core dump [semtimedop()+10] [SIGSEGV] [ADDR:0xC41] [PC:0x32E7CD46BA] [unknown code] []
Incident details in: /oradata/DB112/admin/diag/rdbms/db112/DB112/incident/incdir_26003/DB112_dbw0_4560_i26003.trc
Use ADRCI or Support Workbench to package the incident.
See Note 411.1 at My Oracle Support for error and packaging details.
Mon Apr 16 13:23:36 2012
for simulating a power failure try to send the SIGPWR to a sqlplus session. this will result in:
SQL>
SQL>
SQL> Power failure
conclusion: signals are one more important concept when it comes to understanding the operating system. by sending signals processes are notified about events and are given the chance to take the necessary actions ( if an appropriate handler is present ). when using the kill command you do not necessarily kill a process. what you are doing is sending a signal.
as usual, this is just an introduction and far from being complete ….
when working with the oracle database sooner or later you will face the ORA-07445 error reported in a trace file and the alertlog.
there is plenty of documentation about this error on oracle support and the web. in short: this is an unhandled exception in the oracle code ( in contrast the ORA-00600 errors are handled exceptions ). so why do I want to write about it ? because this is another example where you can map database behavior to the operating system. one common type of the ORA-07445 is this one: “type: SIGSEGV”.
what is this about and what does it stand for ?
software contains bugs. this is true for the linux kernel, this is true for the oracle database and this is true for probably all other software. to deal with unexpected behavior and to protect the system there must be some some sort of exception handler which processes/catches the exceptions once they occur and does the necessary steps to recover from the exceptions. the lowest level exceptions are raised by the CPU and must be handled by the operating system’s kernel. these exception are predefined and the kernel provides an exception handler for each of them.
some of them are:
- division by zero
- segment not present
- stack segment fault
- invalid opcode
- …
you can, for example, check the intel documentation for a complete list of defined exceptions.
when an exception is raised the corresponding exception handler sends a signal to the process which caused the exception. and this is exactly what the SIGSEGV is: it is a signal. signals, for example ( the following list is not complete ), can be:
- SIGSEGV: page faults, overflows
- SIGFPE: divide error
- SIGBUS: stack segments fault
- SIGILL: invalid opcode
most of these exceptions can only occur when the kernel is in user mode, that is, when executing tasks from user programs ( oracle in this case ). there are two ways in which the processor can halt ( or interrupt ) process execution:
- interrupts, which are ansynchron and typically triggered by I/O devices
- exceptions, which are synchron and triggered by the processor when it detects predefined conditions while executing
when the processor halts process execution it switches to the handler routine ( each routine is defined in the interrupt description table, IDT ). once the handler routine has executed its tasks control is given back to the interrupted process.
unfortunately there is not much you can do about it. you can try to find a workaround with oracle support ( e.g. by setting some database parameters or applying a patch ) or check the generated dumps to get some hints on what exactly caused the exception.
a recent search on oracle support returned about 2500 results for the term SIGSEGV. you see, this is not an unusual signal …
as mentioned in the previous post about semaphores there are more things to consider when it comes to interprocess communication. as semaphores are used to protect critical regions, there must be some critical regions to protect and this is the shared memory oracle uses for its communication.
to give an example on how the shared memory addressing works we will take a look at what happens when the database starts up.
for this you’ll need two sessions to a test infrastructure ( one as the database owner, the other as root ).
session one ( oracle ):
connect to sqlplus as sysdba make sure you shutdown the database ( do not exit sqlplus once the database is down ):
sqlplus / as sysdba
shutdown immediate
session two ( root ): discover the PID for then sqlplus session above …
ps -ef | grep sqlp
oracle    3062  3036  0 09:49 pts/1    00:00:00 sqlplus
… check the shared memory segments and trace the sqlplus PID from above:
ipcs -m
------ Shared Memory Segments --------
key        shmid      owner      perms      bytes      nattch     status
0x7401003e 1310720    root      600        4          0
0x74010014 1998849    root      600        4          0
0x00000000 2359298    root      644        80         2
0x74010013 1966083    root      600        4          0
0x00000000 2392068    root      644        16384      2
0x00000000 2424837    root      644        280        2
0x00000000 2490374    grid      640        4096       0
0x00000000 2523143    grid      640        4096       0
0x8e11371c 2555912    grid      640        4096       0
# start the trace
strace -o db_startup.log -fp 3062
it is important to specify the “-f” flag for the strace call. this will tell strace to follow the child processes spawned.
in session one startup the database…
startup
… and stop the tracing in the root session once the database is up and re-check the shared memory segments.
ipcs -m
------ Shared Memory Segments --------
key        shmid      owner      perms      bytes      nattch     status
0x7401003e 1310720    root      600        4          0
0x74010014 1998849    root      600        4          0
0x00000000 2359298    root      644        80         2
0x74010013 1966083    root      600        4          0
0x00000000 2392068    root      644        16384      2
0x00000000 2424837    root      644        280        2
0x00000000 2490374    grid      640        4096       0
0x00000000 2523143    grid      640        4096       0
0x8e11371c 2555912    grid      640        4096       0
0x00000000 3538953    oracle    640        4096       0
0x00000000 3571722    oracle    640        4096       0
0x3393b3a4 3604491    oracle    640        4096       0
as you can see, three more segments appeared after the database started up.
you’ll probably noticed some trace output on the screen similar to this:
Process 3468 detached
Process 3470 attached (waiting for parent)
Process 3470 resumed (parent 3409 ready)
Process 3471 attached (waiting for parent)
Process 3471 resumed (parent 3470 ready)
Process 3469 detached
Process 3470 detached
this is because of the “-f” flag given to strace.
the complete trace output is now available in the db_startup.log trace file and we are ready to take a look at it.
the first thing that catches the eye are the various references to the “/proc” filesystem. in may trace file there are 1213 calls to it. you can check this with:
grep "/proc/" db_startup.log | wc -l
take a look at the previous post which introduces the “/proc” filesystem for more information. for the scope of this post just notice how much depends on it.
the actual startup of the database is triggered by the following line:
execve("/opt/oracle/product/base/11.2.0.3/bin/oracle", ["oracleDB112", "(DESCRIPTION=(LOCAL=YES)(ADDRESS"], [/* 22 vars */]) = 0
this is the call to the oracle binary ( execve executes the binary ) with 22 arguments omitted. from now on the oracle instance starts up.
the calls important to the shared memory stuff are the following:
- brk: changes a data segment’s size
- mmap, munmap: maps/unmaps files or devices into memory
- mprotect: sets protection on a region of memory
- shmget: allocates a shared memory segment
- shmat, shmdt: performs attach/detach operations on shared memory
- get_mempolicy: return NUMA memory policies for a process
- semget: get a semaphore identifier
- semctl: perform control operations on a semaphore
- semop, semtimedop: perform sempahore operations
for each of the above commands you can check the man-pages for more information.
as the trace file is rather large and a lot of things are happening i will focus on the minimum ( this is not about re-engineering oracle :) ):
let’s check the keys returned by the ipcs command above:
egrep "3538953|3571722|3604491" db_startup.log
...
5365  shmget(IPC_PRIVATE, 4096, IPC_CREAT|IPC_EXCL|0640) = 3538953
5365  shmget(IPC_PRIVATE, 4096, IPC_CREAT|IPC_EXCL|0640) = 3571722
5365  shmget(0x3393b3a4, 4096, IPC_CREAT|IPC_EXCL|0640) = 3604491
...
as you can see the identifiers returned by the shmget call ( 3604491,3571722,3538953 ) correspond to the ones reported by ipcs. you wonder about the size of 4096 bytes ? this is because memory_target/memory_max_target is in use by the instance. if the database is configured using sga_target/sga_max_target you would see the actual size. let’s check this:
su - oracle
sqlplus / as sysdba
alter system reset memory_max_target scope=spfile;
alter system reset memory_target scope=spfile;
alter system set sga_max_size=256m scope=spfile;
alter system set sga_target=256m scope=spfile;
alter system set pga_aggregate_target=24m scope=spfile;
startup force;
exit;
# re-check the shared memory segments
ipcs -m
------ Shared Memory Segments --------
key        shmid      owner      perms      bytes      nattch     status
0x00000000 2359298    root      644        80         2
0x00000000 2392068    root      644        16384      2
0x00000000 2424837    root      644        280        2
0x00000000 2490374    grid      640        4096       0
0x00000000 2523143    grid      640        4096       0
0x8e11371c 2555912    grid      640        4096       0
0x00000000 3801097    oracle    640        8388608    25
0x00000000 3833866    oracle    640        260046848  25
0x3393b3a4 3866635    oracle    640        2097152    25
the “260046848” corresponds to the sga size of 256m and the nattch column shows that 25 processes are attached to it. you can double check the 25
attached processes if you want:
ps -ef | grep DB112 | grep -v LISTENER | grep -v grep | wc -l
let’s return to the memory_target/memory_max_target configuration. as oracle puts together all the memory junks ( pga and sga ) the management of memory changes to the virtual shared memory filesystem ( tmpfs ). unfortunately this is not visible with the ipcs command.
but you can map your memory_* sizes to the shm filesystem:
ls -la /dev/shm/ | grep -v "+ASM"
total 466100
drwxrwxrwt  2 root   root        2640 Apr 10 13:09 .
drwxr-xr-x 10 root   root        3400 Apr 10 09:44 ..
-rw-r-----  1 oracle asmadmin 4194304 Apr 10 13:27 ora_DB112_3932169_0
-rw-r-----  1 oracle asmadmin 4194304 Apr 10 13:09 ora_DB112_3932169_1
-rw-r-----  1 oracle asmadmin 4194304 Apr 10 13:09 ora_DB112_3964938_0
-rw-r-----  1 oracle asmadmin 4194304 Apr 10 13:20 ora_DB112_3964938_1
-rw-r-----  1 oracle asmadmin 4194304 Apr 10 13:09 ora_DB112_3964938_10
-rw-r-----  1 oracle asmadmin 4194304 Apr 10 13:20 ora_DB112_3964938_11
-rw-r-----  1 oracle asmadmin 4194304 Apr 10 13:10 ora_DB112_3964938_12
note that i have excluded the ASM stuff here. in my case each segment ( or granule ) is 4mb of size ( this depends on the avaible memory of the system ) and the sum of all the segments should get you near to your memory_* configuration.
as ipcs can not tell you much here there are other commands to use. if you want to know which process has a memory granule open:
fuser -v /dev/shm/ora_DB112_4358154_49
                     USER        PID ACCESS COMMAND
/dev/shm/ora_DB112_4358154_49:
                     oracle     6626 ....m oracle
                     oracle     6628 ....m oracle
                     oracle     6630 ....m oracle
                     oracle     6634 ....m oracle
                     oracle     6636 ....m oracle
                     oracle     6638 ....m oracle
                     oracle     6640 ....m oracle
                     oracle     6642 ....m oracle
                     oracle     6644 ....m oracle
                     oracle     6646 ....m oracle
                     oracle     6648 ....m oracle
                     oracle     6650 ....m oracle
                     oracle     6652 ....m oracle
                     oracle     6654 ....m oracle
                     oracle     6656 ....m oracle
                     oracle     6658 ....m oracle
                     oracle     6662 ....m oracle
                     oracle     6669 ....m oracle
                     oracle     6744 ....m oracle
                     oracle     6767 ....m oracle
                     oracle     6769 ....m oracle
                     oracle     6791 ....m oracle
                     oracle     7034 ....m oracle
or the other way around, if you want to know which files are opened by a specific process:
ps -ef | grep pmon | grep -v "ASM"
oracle    6626     1  0 13:40 ?        00:00:05 ora_pmon_DB112
root      7075  5338  0 14:33 pts/0    00:00:00 grep pmon
# use the pmap command on the PID
pmap 6626
6626:   ora_pmon_DB112
0000000000400000 183436K r-x--  /opt/oracle/product/base/11.2.0.3/bin/oracle
000000000b922000   1884K rwx--  /opt/oracle/product/base/11.2.0.3/bin/oracle
000000000baf9000    304K rwx--    [ anon ]
0000000010c81000    660K rwx--    [ anon ]
0000000060000000      4K r-xs-  /dev/shm/ora_DB112_4325385_0
0000000060001000   4092K rwxs-  /dev/shm/ora_DB112_4325385_0
0000000060400000   4096K rwxs-  /dev/shm/ora_DB112_4325385_1
0000000060800000   4096K rwxs-  /dev/shm/ora_DB112_4358154_0
0000000060c00000   4096K rwxs-  /dev/shm/ora_DB112_4358154_1
0000000061000000   4096K rwxs-  /dev/shm/ora_DB112_4358154_2
0000000061400000   4096K rwxs-  /dev/shm/ora_DB112_4358154_3
0000000061800000   4096K rwxs-  /dev/shm/ora_DB112_4358154_4
0000000061c00000   4096K rwxs-  /dev/shm/ora_DB112_4358154_5
0000000062000000   4096K rwxs-  /dev/shm/ora_DB112_4358154_6
...
if you have troubles starting up your instance with this configuration ( ORA-00845 ) check the size of the virtual filesystem:
df -h
Filesystem            Size  Used Avail Use% Mounted on
/dev/hdc1              28G   14G   12G  54% /
tmpfs                 741M  456M  286M  62% /dev/shm
depending on your configuration ( memory_* or sga_* parameters ) the way that memory is managed changes ( from System V to POSIX, to be exact ).
lots and lots of information. not all of it is important to keep in mind. but what you should remember:
there are several processes and memory segments that make up the oracle instance. as several processes are attached to the same memory regions there must be a way to protect them from concurrent access ( think of semaphores ) … and oracle heavily depends on shared memory. if you scroll through the trace file you’ll notice that there are thousands of operations going on when an oracle instance starts up. imagine what is going on if the instance is under heavy workload and lots and lots of things need protection.
ps: for those interested:
there is plenty of more interesting stuff which you can find in the db_startup.log trace, for example:
writing the audit files:
grep -i adump db_startup.log  | grep -v ASM
3404  open("/oradata/DB112/admin/adump/DB112_ora_3404_2.aud", O_RDWR|O_CREAT|O_EXCL, 0660) = 10
3404  write(10, "/oradata/DB112/admin/adump/DB112"..., 47) = 47
3444  open("/oradata/DB112/admin/adump/DB112_ora_3444_1.aud", O_RDWR|O_CREAT|O_EXCL, 0660) = -1 EEXIST (File exists)
3444  open("/oradata/DB112/admin/adump/DB112_ora_3444_2.aud", O_RDWR|O_CREAT|O_EXCL, 0660) = 8
3444  write(8, "/oradata/DB112/admin/adump/DB112"..., 47) = 47
3481  open("/oradata/DB112/admin/adump/DB112_ora_3481_1.aud", O_RDWR|O_CREAT|O_EXCL, 0660
3481  write(8, "/oradata/DB112/admin/adump/DB112"..., 47) = 47
writing the alert.log:
grep -i "alert_DB112.log" db_startup.log
3404  lstat("/oradata/DB112/admin/diag/rdbms/db112/DB112/trace/alert_DB112.log", {st_mode=S_IFREG|0640, st_size=110201, ...}) = 0
3404  open("/oradata/DB112/admin/diag/rdbms/db112/DB112/trace/alert_DB112.log", O_WRONLY|O_CREAT|O_APPEND, 0660) = 5
3404  lstat("/oradata/DB112/admin/diag/rdbms/db112/DB112/trace/alert_DB112.log", {st_mode=S_IFREG|0640, st_size=110260, ...}) = 0
3404  open("/oradata/DB112/admin/diag/rdbms/db112/DB112/trace/alert_DB112.log", O_WRONLY|O_CREAT|O_APPEND, 0660) = 11
reading the oracle message files:
grep msb db_startup.log
db_startup.log:5438  open("/opt/oracle/product/base/11.2.0.3/oracore/mesg/lrmus.msb", O_RDONLY) = 18
db_startup.log:5438  open("/opt/oracle/product/base/11.2.0.3/oracore/mesg/lrmus.msb", O_RDONLY) = 18
db_startup.log:5430  open("/opt/oracle/product/base/11.2.0.3/rdbms/mesg/oraus.msb", O_RDONLY
db_startup.log:5494  open("/opt/oracle/product/base/11.2.0.3/rdbms/mesg/oraus.msb", O_RDONLY
getting sempahores:
grep semget db_startup.log
5365  semget(IPC_PRIVATE, 1, IPC_CREAT|IPC_EXCL|0600) = 1081346
5365  semget(IPC_PRIVATE, 124, IPC_CREAT|IPC_EXCL|0666) = 1114114
5365  semget(IPC_PRIVATE, 124, IPC_CREAT|0660) = 1146882
5365  semget(0x710dfe10, 0, 0)          = -1 ENOENT (No such file or directory)
5365  semget(0x46db3f80, 0, 0)          = -1 ENOENT (No such file or directory)
5365  semget(0x9ae46084, 0, 0)          = -1 ENOENT (No such file or directory)
5365  semget(0xf6dcc368, 0, 0)          = -1 ENOENT (No such file or directory)
5365  semget(0x710dfe10, 124, IPC_CREAT|IPC_EXCL|0640) = 1179650
some exadata stuff:
3404 open("/etc/oracle/cell/network-config/cellinit.ora", O_RDONLY) = -1 ENOENT (No such file or directory)
and … and …
if you followed the oracle installation guide there are some kernel parameters to be configured for the oracle database. one of them specified by four values is about semaphores:
- semmsl: the maximum number of semaphores per semaphore set
- semmns: the maximum number of semaphore of the entire system
- semopm: number of maximum operations per semop call
- semmni: the maximum number of semaphore sets of the entire system
the question is: what are these semaphores about and what are they for?

a semaphore is a counter associated with a data structure which provides locking and synchronization of critical regions. there is one semaphore ( initialized to 1 ) for each data structure to be protected. the atomic methods “down” and “up” are used to decrease and increase the counter. if the kernel wants access to a protected structure it executes the “down” method and if the result is not negative ( the counter is equal or greater than zero ) access to the resource is granted. if the counter is negative the process which wishes to access the resource is blocked and added to the sempahore list ( a kind of queue ). as time goes by some process finishes its work and executes the “up” method which allows one process in the semaphore list to proceed.
in linux there are two kinds of semaphores:
- kernel semaphores ( for kernel control paths )
- system V IPC semaphores ( for user mode processes ), IPC stands for “interprocess communication”
the IPC semaphores are the ones relevant to the oracle database. semaphores are created by the function semget() which returns the semaphore identifier. there are two other functions for creating ipc resources, which are:
- msgget(): which is for message queues
- shmget(): which is for shared memory
there must be at least one semaphore for each oracle process ( the processes parameter of the database ). as each session to the database needs to be synchronized with other sessions ( and sessions are memory structures ) oracle must request resources from the operation system to be able to handle concurrency in the sga to which all sessions are connected to.
the semaphores queue of pending requests is implemented as a double linked list. you remember? the same concepts over and over again. actually semaphores are sometimes called mutexes ( and there are internal functions like init_MUTEX )… surprised ?
to display the current limits the following command can be used:
ipcs -ls
------ Semaphore Limits --------
max number of arrays = 1024
max semaphores per array = 250
max semaphores system wide = 32000
max ops per semop call = 32
semaphore max value = 32767
or you can directly query the /proc filesystem:
cat /proc/sys/kernel/sem
250 32000 32 1024
to check the currently allocated semaphores:
ipcs -s
------ Semaphore Arrays --------
key semid owner perms nsems
0x127f81f8 163842 oracle 640 124
0x3d2c0d44 1933315 oracle 640 129
0x3d2c0d45 1966084 oracle 640 129
0x3d2c0d46 1998853 oracle 640 129
0x3d2c0d47 2031622 oracle 640 129
0x3d2c0d48 2064391 oracle 640 129
if you want to see some semaphore operations in action do, for example, a strace on the smon process and wait one or two seconds:
ps -ef | grep dbw
oracle 2723 1 0 08:31 ? 00:00:03 ora_smon_dbs300
root 3153 3111 2 09:04 pts/1 00:00:00 grep smon
strace -p 2723
...
semtimedop(819203, {{17, -1, 0}}, 1, {3, 0}) = -1 EAGAIN (Resource temporarily unavailable)
gettimeofday({1333697562, 861932}, NULL) = 0
semtimedop(819203, {{17, -1, 0}}, 1, {3, 0}) = -1 EAGAIN (Resource temporarily unavailable)
gettimeofday({1333697565, 871767}, NULL) = 0
semtimedop(819203, {{17, -1, 0}}, 1, {3, 0}) = -1 EAGAIN (Resource temporarily unavailable)
gettimeofday({1333697568, 893455}, NULL) = 0
semtimedop(819203, {{17, -1, 0}}, 1, {3, 0}) = -1 EAGAIN (Resource temporarily unavailable)
gettimeofday({1333697571, 905050}, NULL) = 0
semtimedop(819203, {{17, -1, 0}}, 1, {3, 0}) = -1 EAGAIN (Resource temporarily unavailable)
gettimeofday({1333697574, 920094}, NULL) = 0
...
here you can clearly see calls to semtimedop which return with -1 ( EAGAIN, the call expired ).
if you followed the series on how to setup a test infrastructure or you have a test infrastructure available to play with here is a little demonstration:
be sure to save your current kernel semaphore settings:
cat /proc/sys/kernel/sem
250 32000 32 1024
minimize the settings to very low values and try to restart ( or start ) the oracle instance:
su-
echo "2 10 1 2" > /proc/sys/kernel/sem
if you write the values to the /proc/sys/kernel/…-parameter files the values will be in effect immediately. be sure what you are doing if you’re touching these parameters.
startup or restart the oracle instance:
su - oracle
sqlplus / as sysdba
startup force
ORA-27154: post/wait create failed
ORA-27300: OS system dependent operation:semget failed with status: 28
ORA-27301: OS failure message: No space left on device
ORA-27302: failure occurred at: sskgpbitsper
what happened ? the database was not able to allocate the resources ( sempahores ) it needs, thus can not start up. the message “No space left on device” indicates some issue with disk space, but it’s actually the memory in question here. fyi: the allocation of semaphores ( and shared memory ) does only occur during the “startup nomount” phase. this is the only time oracle requests this resources.
fix it, and try again:
su -
echo "250 32000 32 1024" > /proc/sys/kernel/sem
su - oracle
startup force
conclusion: semaphores are one critical part for interprocess communication and provide a way for locking and synchronization. if the database can not allocate the resources it needs from the operating system it will fail to start up.
the values recommended in the installation guides are minimum values. if your session count to the database grows you may need to adjust the semaphore parameters.
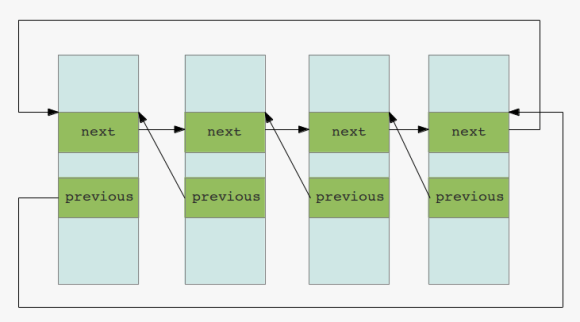
when it comes to the management of processes and data structures there is one essential concept: double linked lists
you can think of this concept as n lists ( memory structures ) linked together each containing pointers to the next and to the previous list:
 double linked lists
from the perspective of the linux kernel this lists help, for example, in tracking all the processes in the system. if it comes to the oracle database there is the same concept. all the caches and pools are based on double linked lists.
one place where you can see that oracle uses the same concept is the buffer headers. although you can not see it in v$bh oracle exposes the information in the underlying x$bh:
SQL> select NXT_REPL,PRV_REPL from x$bh where rownum < 5;
NXT_REPL PRV_REPL
-------- --------
247E550C 247E535C
23BE334C 23BE319C
23BF38DC 23BF372C
22FE694C 22FE679C
these are some pointers to the next and previous lists mentioned above. you can even check the relations:
SQL> select NXT_REPL,PRV_REPL from x$bh where NXT_REPL = '23BF38DC' or PRV_REPL = '23BF38DC';
NXT_REPL PRV_REPL
-------- --------
23BF38DC 23BF372C
23BF3A8C 23BF38DC
for managing these lists there must be some atomic ( notice the vocabulary, it’s the same as the A in ACID ) operations implemented:
- initialize the list
- inserting and deleting elements
- walking through the list for finding an element
- checking for empty elements in the list
- …
the list of processes in linux is called the process list. this list links together all the processes in the system, more exactly: it links together all the process descriptors. if the kernel wants to know which processes are ready to run, it scans the list for all processes in state TASK_RUNNING. there are several others states a process can be in:
- TASK_RUNNING: the process waits to be executed or currently is executing
- TASK_INTERRUPTIBLE: the process sleeps until some event occurs
- TASK_UNINTERRUPTIBLE: the process sleeps and will not wake up on a signal
- TASK_STOPPED: the process is stopped
- TASK_TRACED: the process is being traced
when one process creates one or more other processes there are one or more parent/child relationships. this relationships are present in the process descriptors. the init process ( which is pid 1 ) is the master ( or the anchor ) of all other processes. all this relations are managed by linked lists.
for the kernel to quickly find an entry in one of the lists another concept is introduced: hashing. hashing data is an efficient way to locate an element in a list. for example the number 85 might hash to the 10th entry of a list ( so after hashing the kernel can jump directly to this entry instead of scanning the whole list for the value in question ). this is another link to the oracle database as oracle is excessively using hashing, too ( for example to quickly locate sql-statements in the shared pool oracle hashes the text of the statement ).
you probably heard of locks in the oracle world. next link between the os and the database. when elements of lists are modified there is a need to protect them from concurrent access. imagine what happens if two ( or more ) processes try to modify the same data at the same time. this is where locks come into play: locks provide a mechanism for synchronization. in the linux kernels wait queues, for example, there are exclusive processes and nonexclusive processes. the latter are always woken up by the kernel if some specific events occur while the exclusive processes are woken up selectively ( for example if they want to access a resource only one processes can be granted to at a time ). again, you see same vocabulary here than in the oracle database world: there are exclusive locks, shared locks, etc.
by the way: keeping the duration of the locks as short as possible without risking data inconsistency is one key to performance. because if there are locks there is very good chance that others have to wait until the locks disappear ( and waiting is wasted time in terms of performance ). this is why mutexes appeared in the oracle database: they provide a faster way of protecting data than the traditional latches ( which are a kind of lock in the oracle database ).
conclusion: if you understand how the operating system handles resources it is not a big deal to understand some basic workings of the database. much is about double linked lists and protecting data. even the vocabulary is the same very often. you see the same terms over and over again ( queues, locks, spins, lists, waits …. ).
if you want to go into more detail on how oracle handles lists, check out james morle’s book scalingoracle8i which is available for download now. don’t care about the 8i, the basics are still the same.
happy listing …
this post will continue the introduction post to linux processes and shows how the listener handles connection requests to the database.
let’s check the listeners pid:
ps -ef | grep tns
grid 2646 1 0 10:47 ? 00:00:03 /opt/oracle/product/base/11.2.0.3/bin/tnslsnr LISTENER_DB112 -inherit
as the listener needs to handle connections there must be some sorts of open files for the listener process:
[root@oracleplayground ~]# ls -la /proc/2646/fd/
total 0
dr-x------ 2 grid oinstall 0 Apr 4 10:47 .
dr-xr-xr-x 6 grid oinstall 0 Apr 4 10:47 ..
lrwx------ 1 grid oinstall 64 Apr 4 15:29 0 -> /dev/null
lrwx------ 1 grid oinstall 64 Apr 4 15:29 1 -> /dev/null
lrwx------ 1 grid oinstall 64 Apr 4 15:29 10 -> socket:[7875]
lrwx------ 1 grid oinstall 64 Apr 4 15:29 11 -> socket:[7877]
lrwx------ 1 grid oinstall 64 Apr 4 15:29 12 -> socket:[7949]
lrwx------ 1 grid oinstall 64 Apr 4 15:29 13 -> socket:[7950]
lrwx------ 1 grid oinstall 64 Apr 4 15:29 15 -> socket:[12719]
lrwx------ 1 grid oinstall 64 Apr 4 15:29 2 -> /dev/null
lr-x------ 1 grid oinstall 64 Apr 4 15:29 3 -> /opt/oracle/product/base/11.2.0.3/rdbms/mesg/diaus.msb
lr-x------ 1 grid oinstall 64 Apr 4 15:29 4 -> /proc/2646/fd
lr-x------ 1 grid oinstall 64 Apr 4 15:29 5 -> /opt/oracle/product/base/11.2.0.3/network/mesg/nlus.msb
lr-x------ 1 grid oinstall 64 Apr 4 15:29 6 -> pipe:[7822]
lr-x------ 1 grid oinstall 64 Apr 4 15:29 7 -> /opt/oracle/product/base/11.2.0.3/network/mesg/tnsus.msb
lrwx------ 1 grid oinstall 64 Apr 4 15:29 8 -> socket:[7873]
l-wx------ 1 grid oinstall 64 Apr 4 15:29 9 -> pipe:[7823]
[root@oracleplayground ~]#
this tells us that the listener has 15 open file descriptors of which 8,10-15 are sockets and 9 is a pipe.
let’s request a connection to the database through the listener and trace the listener process in parallel:
Session 1 ( as root ):
strace -p 2646
Session 2 ( as oracle ):
sqlplus a/a@DB112
the strace output ( i have number the lines ) should look similar to this:
1: poll([{fd=8, events=POLLIN|POLLRDNORM}, {fd=11, events=POLLIN|POLLRDNORM}, {fd=12, events=POLLIN|POLLRDNORM}, {fd=13, events=POLLIN|POLLRDNORM}, {fd=15, events=POLLIN|POLLRDNORM}, {fd=-1}, {fd=-1}], 7, -1) = 1 ([{fd=13, revents=POLLIN|POLLRDNORM}])
2: times({tms_utime=76, tms_stime=325, tms_cutime=0, tms_cstime=1}) = 431191568
3: getsockname(13, {sa_family=AF_INET, sin_port=htons(1521), sin_addr=inet_addr("127.0.0.1")}, [11087335753955409936]) = 0
4: getpeername(13, 0x7fffc6b5d1a8, [11087335753955409936]) = -1 ENOTCONN (Transport endpoint is not connected)
5: accept(13, {sa_family=AF_INET, sin_port=htons(23139), sin_addr=inet_addr("127.0.0.1")}, [68719476752]) = 14
6: getsockname(14, {sa_family=AF_INET, sin_port=htons(1521), sin_addr=inet_addr("127.0.0.1")}, [68719476752]) = 0
7: fcntl(14, F_SETFL, O_RDONLY|O_NONBLOCK) = 0
8: getsockopt(14, SOL_SOCKET, SO_SNDBUF, [-4128159149999471140], [4]) = 0
9: getsockopt(14, SOL_SOCKET, SO_RCVBUF, [-4128159149999434336], [4]) = 0
10: setsockopt(14, SOL_TCP, TCP_NODELAY, [1], 4) = 0
11: fcntl(14, F_SETFD, FD_CLOEXEC) = 0
12: times({tms_utime=76, tms_stime=325, tms_cutime=0, tms_cstime=1}) = 431191568
13: rt_sigaction(SIGPIPE, {0x1, ~[ILL ABRT BUS FPE SEGV USR2 XCPU XFSZ SYS RTMIN RT_1], SA_RESTORER|SA_RESTART|SA_SIGINFO, 0x32e840ebe0}, {0x1, ~[ILL ABRT BUS FPE KILL SEGV USR2 STOP XCPU XFSZ SYS RTMIN RT_1], SA_RESTORER|SA_RESTART|SA_SIGINFO, 0x32e840ebe0}, 8) = 0
14: times({tms_utime=76, tms_stime=325, tms_cutime=0, tms_cstime=1}) = 431191568
15: times({tms_utime=76, tms_stime=325, tms_cutime=0, tms_cstime=1}) = 431191568
16: poll([{fd=8, events=POLLIN|POLLRDNORM}, {fd=11, events=POLLIN|POLLRDNORM}, {fd=12, events=POLLIN|POLLRDNORM}, {fd=13, events=POLLIN|POLLRDNORM}, {fd=15, events=POLLIN|POLLRDNORM}, {fd=14, events=POLLIN|POLLRDNORM}, {fd=-1}], 7, 60000) = 1 ([{fd=14, revents=POLLIN|POLLRDNORM}])
17: read(14, "\335\1\1:\1,\fA \377\377\177\10\1\243:\10"..., 8208) = 221
18: fcntl(14, F_GETFL) = 0x802 (flags O_RDWR|O_NONBLOCK)
19: fcntl(14, F_SETFL, O_RDWR) = 0
20: times({tms_utime=76, tms_stime=325, tms_cutime=0, tms_cstime=1}) = 431191569
21: fcntl(14, F_SETFD, 0) = 0
22: pipe([16, 17]) = 0
23: pipe([18, 19]) = 0
24: clone(child_stack=0, flags=CLONE_CHILD_CLEARTID|CLONE_CHILD_SETTID|SIGCHLD, child_tidptr=0x2ac09be5bb80) = 5894
25: wait4(5894, [{WIFEXITED(s) && WEXITSTATUS(s) == 0}], 0, NULL) = 5894
26: close(16) = 0
27: close(19) = 0
28: fcntl(18, F_SETFD, FD_CLOEXEC) = 0
29: fcntl(17, F_SETFD, FD_CLOEXEC) = 0
30: fcntl(14, F_SETFD, FD_CLOEXEC) = 0
31: poll([{fd=8, events=POLLIN|POLLRDNORM}, {fd=11, events=POLLIN|POLLRDNORM}, {fd=12, events=POLLIN|POLLRDNORM}, {fd=13, events=POLLIN|POLLRDNORM}, {fd=15, events=POLLIN|POLLRDNORM}, {fd=18, events=POLLIN|POLLRDNORM}, {fd=17, events=0}], 7, -1) = 1 ([{fd=18, revents=POLLIN|POLLRDNORM}])
32: read(18, "NTP0 5895\n", 64) = 10
33: write(17, ";", 4) = 4
34: write(17, "(ADDRESS=(PROTOCOL=tcp)(DEV=14)("..., 59) = 59
35: write(17, "\1\4", 8) = 8
36: read(18, "", 4) = 4
37: read(18, "*1", 4) = 4
38: write(14, "\10\v", 8) = 8
39: close(17) = 0
40: close(18) = 0
41: close(14) = 0
42: lseek(7, 19968, SEEK_SET) = 19968
43: read(7, "\f005\4P006\4j007\4\206008\4\240009\4\335"..., 512) = 512
44: poll([{fd=8, events=POLLIN|POLLRDNORM}, {fd=11, events=POLLIN|POLLRDNORM}, {fd=12, events=POLLIN|POLLRDNORM}, {fd=13, events=POLLIN|POLLRDNORM}, {fd=15, events=POLLIN|POLLRDNORM}, {fd=-1}, {fd=-1}], 7, -1) = 1 ([{fd=15, revents=POLLIN|POLLRDNORM}])
45: Process 2646 detached
a lot of cryptic output, isn’t it? let’s take a closer look on what’s happening:
on line one you can see a call to “poll”. poll waits for some events on the file descriptors. as connections are files, you may say it waits for some sort of connections.
on line two you can see a call to times, which returns several process times.
on line three there is a call to getsockname which returns the socket name for this address: {sa_family=AF_INET, sin_port=htons(1521), sin_addr=inet_addr(“127.0.0.1”)}, which is
the listener on port 1521 ( sa_family: this is the address family, AF_INET is the one used for IP, sin_port: is the port, sin_addr: is the address, in this case localhost ).
the call on line four ( getpeername ) does what it is called: get the name of the connected peer. it returns with ENOTCONN ( the socket is not connected ). next, one line five, a connection to the socket is accepted. notice that a new file descriptor is created ( 14 ) and passed to the getsockname call on line six. getsockname returns with code 0, which is success. now there is a connected endpoint which is our request to the listener.
the call to fcntl on line 7 modifies the file descriptor: set the file status flags ( F_SETFL ) to read only ( O_RDONLY ) and block system calls ( O_NONBLOCK ).
on line 8 and 9 the values of the sockets receive and sent buffers are read and on line 10 the TCP option TCP_NODELAY ( which disables Nagle’s algorithm ) is set.
next, on line 11, the socket is modified to close when a call to an exec function is performed. from now on I will ignore the calls to times, as I have described it above.
on line 13 rt_sigaction changes the action taken by the process on receipt of a signal and line 17 reads from the file associated with the file
descriptor ( ignore line 14,15,16 ). line 18 again reads the file descriptor flags and line 19 sets the flag for read/write ( O_RDWR ) and line 21
resets the file descriptor flags to the defaults.
line 22 and 23 create a pair of file descriptors pointing to a pipe inode ( the first is for reading, the second for writing ). the clone call on line 24 does interesting stuff, it creates a new process with is 5894 and line 25 waits for the new process to change its state ( the child_stack=0 indicates that a process is created, not a thread ), in other words it waits for the process to exit.
if we now do a check if the process is there, you will notice that no process with this PID exists ( this is probably because it is the PID of the clone itself ):
ps -ef | grep 5894
root 5984 5611 0 15:58 pts/3 00:00:00 grep 5894
but what exists, is PID+1 ( which you can see on line 32 ):
ps -ef | grep 5895
oracle 5895 1 0 15:44 ? 00:00:00 oracleDB112 (LOCAL=NO)
root 5997 5611 0 16:00 pts/3 00:00:00 grep 5895
… which is our connection to the database. if you check this process you will see that the socket 14 is now available in the newly created process:
ls -la /proc/5895/fd
total 0
dr-x------ 2 root root 0 Apr 4 15:44 .
dr-xr-xr-x 6 oracle asmadmin 0 Apr 4 15:44 ..
lr-x------ 1 root root 64 Apr 4 16:00 0 -> /dev/null
l-wx------ 1 root root 64 Apr 4 16:00 1 -> /dev/null
lrwx------ 1 root root 64 Apr 4 16:00 14 -> socket:[102504]
l-wx------ 1 root root 64 Apr 4 16:00 2 -> /dev/null
lr-x------ 1 root root 64 Apr 4 16:00 3 -> /dev/null
lr-x------ 1 root root 64 Apr 4 16:00 4 -> /dev/null
lr-x------ 1 root root 64 Apr 4 16:00 5 -> /opt/oracle/product/base/11.2.0.3/rdbms/mesg/oraus.msb
lr-x------ 1 root root 64 Apr 4 16:00 6 -> /proc/5895/fd
lr-x------ 1 root root 64 Apr 4 16:00 7 -> /dev/zero
the remaining lines will close some files ( including the listeners file descriptor 14 ) and write some data. i will ignore the rest of the output as it should be clear now, how the listener hands off the connections to the database: it listens to incoming requests on the defined port and creates a new process which is the database connection. that’s all the listener does. once the connection is established there is no more work to do for the listener and it looses control of the newly created process.
just one more thing of interest: the lseek and read calls to file descriptor 7 ( lines 42 and 43 ) are positioning and reading the file containing the tns messages. you can check this with:
strings /opt/oracle/product/base/11.2.0.3/network/mesg/tnsus.msb
this are the messages the listener returns.
happy listening …
