
if you are not sure what these abbreviations all stand for:
demo@orademo.local oracle:/home/oracle/adhocScripts $ ps -ef | grep ora_
oracle    2016     1  0 15:33 ?        00:00:28 ora_pmon_demo
oracle    2018     1  0 15:33 ?        00:00:49 ora_psp0_demo
oracle    2020     1 15 15:33 ?        00:39:48 ora_vktm_demo
oracle    2024     1  0 15:33 ?        00:00:19 ora_gen0_demo
oracle    2026     1  0 15:33 ?        00:00:21 ora_diag_demo
oracle    2028     1  0 15:33 ?        00:00:19 ora_dbrm_demo
oracle    2030     1  0 15:33 ?        00:01:14 ora_dia0_demo
oracle    2032     1  0 15:33 ?        00:00:18 ora_mman_demo
oracle    2034     1  0 15:33 ?        00:00:22 ora_dbw0_demo
oracle    2036     1  0 15:33 ?        00:00:27 ora_lgwr_demo
oracle    2038     1  0 15:33 ?        00:00:47 ora_ckpt_demo
oracle    2040     1  0 15:33 ?        00:00:12 ora_smon_demo
oracle    2042     1  0 15:33 ?        00:00:09 ora_reco_demo
oracle    2044     1  0 15:33 ?        00:00:45 ora_mmon_demo
oracle    2046     1  0 15:33 ?        00:01:20 ora_mmnl_demo
oracle    2054     1  0 15:34 ?        00:00:10 ora_qmnc_demo
oracle    2070     1  0 15:34 ?        00:00:09 ora_q001_demo
oracle    2099     1  0 15:39 ?        00:00:18 ora_smco_demo
oracle    2214     1  0 16:01 ?        00:00:10 ora_q002_demo
oracle    2811     1  0 19:39 ?        00:00:00 ora_w000_demo
oracle    2826  2760  0 19:43 pts/3    00:00:00 grep ora_
… just ask the database:
select NAME,DESCRIPTION from v$bgprocess order by 1;

NAME  DESCRIPTION
----- ----------------------------------------------------------------
ABMR  Auto BMR Background Process
ACFS  ACFS CSS
ACMS  Atomic Controlfile to Memory Server
ARB0  ASM Rebalance 0
ARB1  ASM Rebalance 1
ARB2  ASM Rebalance 2
ARB3  ASM Rebalance 3
ARB4  ASM Rebalance 4
ARB5  ASM Rebalance 5
ARB6  ASM Rebalance 6
ARB7  ASM Rebalance 7
ARB8  ASM Rebalance 8
ARB9  ASM Rebalance 9
ARBA  ASM Rebalance 10
ARC0  Archival Process 0
ARC1  Archival Process 1
ARC2  Archival Process 2
ARC3  Archival Process 3
ARC4  Archival Process 4
ARC5  Archival Process 5
ARC6  Archival Process 6
ARC7  Archival Process 7
ARC8  Archival Process 8
ARC9  Archival Process 9
ARCa  Archival Process 10
ARCb  Archival Process 11
ARCc  Archival Process 12
ARCd  Archival Process 13
ARCe  Archival Process 14
ARCf  Archival Process 15
ARCg  Archival Process 16
ARCh  Archival Process 17
ARCi  Archival Process 18
ARCj  Archival Process 19
ARCk  Archival Process 20
ARCl  Archival Process 21
ARCm  Archival Process 22
ARCn  Archival Process 23
ARCo  Archival Process 24
ARCp  Archival Process 25
ARCq  Archival Process 26
ARCr  Archival Process 27
ARCs  Archival Process 28
ARCt  Archival Process 29
ASMB  ASM Background
CJQ0  Job Queue Coordinator
CKPT  checkpoint
CTWR  Change Tracking Writer
DBRM  DataBase Resource Manager
DBW0  db writer process 0
DBW1  db writer process 1
DBW2  db writer process 2
DBW3  db writer process 3
DBW4  db writer process 4
DBW5  db writer process 5
DBW6  db writer process 6
DBW7  db writer process 7
DBW8  db writer process 8
DBW9  db writer process 9
DBWa  db writer process 10 (a)
DBWb  db writer process 11 (b)
DBWc  db writer process 12 (c)
DBWd  db writer process 13 (d)
DBWe  db writer process 14 (e)
DBWf  db writer process 15 (f)
DBWg  db writer process 16 (g)
DBWh  db writer process 17 (h)
DBWi  db writer process 18 (i)
DBWj  db writer process 19 (j)
DBWk  db writer process 20 (k)
DBWl  db writer process 21 (l)
DBWm  db writer process 22 (m)
DBWn  db writer process 23 (n)
DBWo  db writer process 24 (o)
DBWp  db writer process 25 (p)
DBWq  db writer process 26 (q)
DBWr  db writer process 27 (r)
DBWs  db writer process 28 (s)
DBWt  db writer process 29 (t)
DBWu  db writer process 30 (u)
DBWv  db writer process 31 (v)
DBWw  db writer process 32 (w)
DBWx  db writer process 33 (x)
DBWy  db writer process 34 (y)
DBWz  db writer process 35 (z)
DIA0  diagnosibility process 0
DIA1  diagnosibility process 1
DIA2  diagnosibility process 2
DIA3  diagnosibility process 3
DIA4  diagnosibility process 4
DIA5  diagnosibility process 5
DIA6  diagnosibility process 6
DIA7  diagnosibility process 7
DIA8  diagnosibility process 8
DIA9  diagnosibility process 9
DIAG  diagnosibility process
DMON  DG Broker Monitor Process
DSKM  slave DiSKMon process
EMNC  EMON Coordinator
FBDA  Flashback Data Archiver Process
FMON  File Mapping Monitor Process
FSFP  Data Guard Broker FSFO Pinger
GEN0  generic0
GMON  diskgroup monitor
GTX0  Global Txn process 0
GTX1  Global Txn process 1
GTX2  Global Txn process 2
GTX3  Global Txn process 3
GTX4  Global Txn process 4
GTX5  Global Txn process 5
GTX6  Global Txn process 6
GTX7  Global Txn process 7
GTX8  Global Txn process 8
GTX9  Global Txn process 9
GTXa  Global Txn process 10
GTXb  Global Txn process 11
GTXc  Global Txn process 12
GTXd  Global Txn process 13
GTXe  Global Txn process 14
GTXf  Global Txn process 15
GTXg  Global Txn process 16
GTXh  Global Txn process 17
GTXi  Global Txn process 18
GTXj  Global Txn process 19
INSV  Data Guard Broker INstance SlaVe Process
LCK0  Lock Process 0
LGWR  Redo etc.
LMD0  global enqueue service daemon 0
LMHB  lm heartbeat monitor
LMON  global enqueue service monitor
LMS0  global cache service process 0
LMS1  global cache service process 1
LMS2  global cache service process 2
LMS3  global cache service process 3
LMS4  global cache service process 4
LMS5  global cache service process 5
LMS6  global cache service process 6
LMS7  global cache service process 7
LMS8  global cache service process 8
LMS9  global cache service process 9
LMSa  global cache service process 10
LMSb  global cache service process 11
LMSc  global cache service process 12
LMSd  global cache service process 13
LMSe  global cache service process 14
LMSf  global cache service process 15
LMSg  global cache service process 16
LMSh  global cache service process 17
LMSi  global cache service process 18
LMSj  global cache service process 19
LMSk  global cache service process 20
LMSl  global cache service process 21
LMSm  global cache service process 22
LMSn  global cache service process 23
LMSo  global cache service process 24
LMSp  global cache service process 25
LMSq  global cache service process 26
LMSr  global cache service process 27
LMSs  global cache service process 28
LMSt  global cache service process 29
LMSu  global cache service process 30
LMSv  global cache service process 31
LMSw  global cache service process 32
LMSx  global cache service process 33
LMSy  global cache service process 34
LSP0  Logical Standby
LSP1  Dictionary build process for Logical Standby
LSP2  Set Guard Standby Information for Logical Standby
MARK  mark AU for resync koordinator
MMAN  Memory Manager
MMNL  Manageability Monitor Process 2
MMON  Manageability Monitor Process
MRP0  Managed Standby Recovery
NSA1  Redo transport NSA1
NSA2  Redo transport NSA2
NSA3  Redo transport NSA3
NSA4  Redo transport NSA4
NSA5  Redo transport NSA5
NSA6  Redo transport NSA6
NSA7  Redo transport NSA7
NSA8  Redo transport NSA8
NSA9  Redo transport NSA9
NSAA  Redo transport NSAA
NSAB  Redo transport NSAB
NSAC  Redo transport NSAC
NSAD  Redo transport NSAD
NSAE  Redo transport NSAE
NSAF  Redo transport NSAF
NSAG  Redo transport NSAG
NSAH  Redo transport NSAH
NSAI  Redo transport NSAI
NSAJ  Redo transport NSAJ
NSAK  Redo transport NSAK
NSAL  Redo transport NSAL
NSAM  Redo transport NSAM
NSAN  Redo transport NSAN
NSAO  Redo transport NSAO
NSAP  Redo transport NSAP
NSAQ  Redo transport NSAQ
NSAR  Redo transport NSAR
NSAS  Redo transport NSAS
NSAT  Redo transport NSAT
NSAU  Redo transport NSAU
NSAV  Redo transport NSAV
NSS1  Redo transport NSS1
NSS2  Redo transport NSS2
NSS3  Redo transport NSS3
NSS4  Redo transport NSS4
NSS5  Redo transport NSS5
NSS6  Redo transport NSS6
NSS7  Redo transport NSS7
NSS8  Redo transport NSS8
NSS9  Redo transport NSS9
NSSA  Redo transport NSSA
NSSB  Redo transport NSSB
NSSC  Redo transport NSSC
NSSD  Redo transport NSSD
NSSE  Redo transport NSSE
NSSF  Redo transport NSSF
NSSG  Redo transport NSSG
NSSH  Redo transport NSSH
NSSI  Redo transport NSSI
NSSJ  Redo transport NSSJ
NSSK  Redo transport NSSK
NSSL  Redo transport NSSL
NSSM  Redo transport NSSM
NSSN  Redo transport NSSN
NSSO  Redo transport NSSO
NSSP  Redo transport NSSP
NSSQ  Redo transport NSSQ
NSSR  Redo transport NSSR
NSSS  Redo transport NSSS
NSST  Redo transport NSST
NSSU  Redo transport NSSU
NSSV  Redo transport NSSV
NSV0  Data Guard Broker NetSlave Process 0
NSV1  Data Guard Broker NetSlave Process 1
NSV2  Data Guard Broker NetSlave Process 2
NSV3  Data Guard Broker NetSlave Process 3
NSV4  Data Guard Broker NetSlave Process 4
NSV5  Data Guard Broker NetSlave Process 5
NSV6  Data Guard Broker NetSlave Process 6
NSV7  Data Guard Broker NetSlave Process 7
NSV8  Data Guard Broker NetSlave Process 8
NSV9  Data Guard Broker NetSlave Process 9
NSVA  Data Guard Broker NetSlave Process A
NSVB  Data Guard Broker NetSlave Process B
NSVC  Data Guard Broker NetSlave Process C
NSVD  Data Guard Broker NetSlave Process D
NSVE  Data Guard Broker NetSlave Process E
NSVF  Data Guard Broker NetSlave Process F
NSVG  Data Guard Broker NetSlave Process G
NSVH  Data Guard Broker NetSlave Process H
NSVI  Data Guard Broker NetSlave Process I
NSVJ  Data Guard Broker NetSlave Process J
NSVK  Data Guard Broker NetSlave Process K
NSVL  Data Guard Broker NetSlave Process L
NSVM  Data Guard Broker NetSlave Process M
NSVN  Data Guard Broker NetSlave Process N
NSVO  Data Guard Broker NetSlave Process O
NSVP  Data Guard Broker NetSlave Process P
NSVQ  Data Guard Broker NetSlave Process Q
NSVR  Data Guard Broker NetSlave Process R
NSVS  Data Guard Broker NetSlave Process S
NSVT  Data Guard Broker NetSlave Process T
NSVU  Data Guard Broker NetSlave Process U
PING  interconnect latency measurement
PMON  process cleanup
PSP0  process spawner 0
QMNC  AQ Coordinator
RBAL  ASM Rebalance master
RCBG  Result Cache: Background
RECO  distributed recovery
RMS0  rac management server
RSM0  Data Guard Broker Resource Guard Process 0
RSMN  Remote Slave Monitor
RVWR  Recovery Writer
SMCO  Space Manager Process
SMON  System Monitor Process
VBG0  Volume BG 0
VBG1  Volume BG 1
VBG2  Volume BG 2
VBG3  Volume BG 3
VBG4  Volume BG 4
VBG5  Volume BG 5
VBG6  Volume BG 6
VBG7  Volume BG 7
VBG8  Volume BG 8
VBG9  Volume BG 9
VDBG  Volume Driver BG
VKRM  Virtual sKeduler for Resource Manager
VKTM  Virtual Keeper of TiMe process
VMB0  Volume Membership 0
XDMG  cell automation manager
XDWK  cell automation worker actions

295 rows selected.

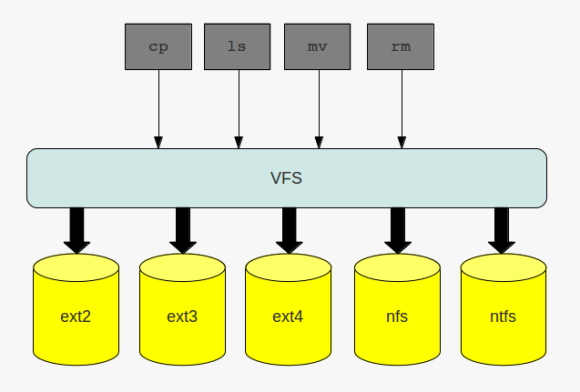 the virtual file system
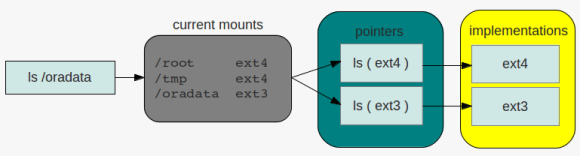 directory listing
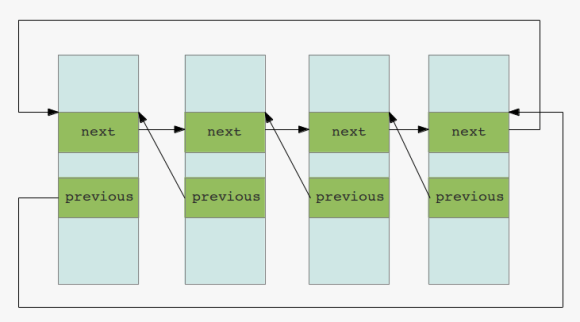 double linked lists