how does one retrieve data from the database ? by using the sql language. sql is easy to learn and everyone can write statetments, but many times the user who fires a statement has little or no knowledge on how the data is organized and stored inside the database system.
this is where the optimizer comes into the game. once the statement reaches the database it is the task of the optimizer to find the fastest and most efficient way to the data. to make things a littler easier to understand lets start with an example:
imagine the following the scenario:
- as the teacher is ill you have been asked to teach the class
- the subject of todays class is J.R.R. Tolkien’s Lord of the Rings
- the students are allowed to ask any question which can be answered by reading the book
- all you have to answer the questions is the book, your memory, a blank paper and a pencil
in this scenario you are the optimizer while the books is the entity which stores the actual data. the students represent the users querying the database. it is your ( the optimizers ) task to find the most efficient way to answer your student’s questions. the problem is: nobody told you what is the subject of todays class and, oh my god, you never read the book :) anyway, as the real teacher is a good friend of you, you decided to give your best.
lets set up the scenario. first of all we’ll need a table which represents our book:
DROP TABLE LORDOFTHERINGS;
CREATE TABLE LORDOFTHERINGS ( PAGENUMBER NUMBER
, CHAPTER NUMBER
, TEXT VARCHAR2(4000)
)
TABLESPACE USERS;
as a book without any content would not be worth reading lets generate some content:
DECLARE
  ln_chapter lordoftherings.chapter%TYPE := 0;
  -- same stupid text for all pages, for now
  lv_text lordoftherings.text%TYPE := LPAD('GOLLUM IS SAD',4000,'BLABLA');
BEGIN
  FOR
    i IN 1..10000
  LOOP
    -- each chapter will have 50 pages
    IF
      mod(i,50) = 0
    THEN
      ln_chapter := ln_chapter + 1;
    END IF;
    INSERT INTO LORDOFTHERINGS ( PAGENUMBER, CHAPTER, TEXT )
           VALUES ( i, ln_chapter, lv_text );
  END LOOP;
  COMMIT;
END;
/
-- as we know there is a bad warlock called sauron:
UPDATE LORDOFTHERINGS
   SET TEXT = 'SAURON'
 WHERE MOD(pagenumber,77) = 0;
-- ... and hobbits play some kind of role
UPDATE LORDOFTHERINGS
   SET TEXT = 'HOBBITS'
 WHERE MOD(pagenumber,111) = 0;
-- ... and there is the good counterpart to sauron called gandalf
UPDATE LORDOFTHERINGS
   SET TEXT = 'GANDALF'
 WHERE MOD(pagenumber,201) = 0;
UPDATE LORDOFTHERINGS
   SET TEXT = 'RING'
 WHERE MOD(pagenumber,2) = 0;
COMMIT;
so our book is ready:
- there is a total of 10’000 pages, each containing a maximum of 4’000 characters
- there are 200 chapters, each consisting of 50 pages
- on some pages the story tells about hobbits
- on some pages the story tells about sauron
- on some pages the story tells about gandalf
- on every second page the ring is mentioned
your class opens, the students are coming in and prepare to ask the questions they’d like to have answered from your side. remember, you are the expert. the students do not know that you never read the book. this is the same situation as when the database queries a table for the first time. for our scenario this means…
alter system flush buffer_cache;
… which erases the buffer cache of the database ( no brain available currently, or at least the brain has nothing to remember ).
07:31 am ( almost in time ), first question from a student: how many pages does the book consist of ?
puh, easy. isn’t it? just open the book go to the last page and take a look at the page number. really ? are you sure all pages are numbered including the first few pages which introduce the author and the last ones which may contain some advertising for other books one may be interested in ? perhaps the author decided to start over with page number one for each chapter ? not as simple as you thought. the only option you have: count all the pages. this is the only option which will give the correct answer. if you take a look the thickness of book you could guess that there should be around 10’000 pages ( if you are good at guessing how many pages a book may consist of ), but you can’t know for sure. you just did what the optimizer will do if a statement like this comes in:
SELECT count(pagenumber)
  FROM lordoftherings;
the only option the optimizer has available at this very moment is to do a full tablescan, that is reading every block of the table:
ALTER SYSTEM FLUSH BUFFER_CACHE;
SET AUTOTRACE TRACEONLY;
SELECT count(pagenumber)
  FROM lordoftherings;
Execution Plan
----------------------------------------------------------
Plan hash value: 4101815809
-------------------------------------------------------------------------------------
| Id  | Operation	   | Name	    | Rows  | Bytes | Cost (%CPU)| Time     |
-------------------------------------------------------------------------------------
|   0 | SELECT STATEMENT   |		    |	  1 |	 13 |  2739   (1)| 00:00:33 |
|   1 |  SORT AGGREGATE    |		    |	  1 |	 13 |		 |	    |
|   2 |   TABLE ACCESS FULL| LORDOFTHERINGS | 11059 |	140K|  2739   (1)| 00:00:33 |
-------------------------------------------------------------------------------------
you probably noticed that the 11059 rows reported in the above plan are wrong. that’s the guess mentioned above. you ( the optimizer ) guess that 11059 will be the correct answer. this guess is based on dynamic sampling which is reported under the “Note” section. as you could guess the number of pages by looking at the thickness of the book the optimizer uses dynamic sampling if it has no other statistics available which may help in finding the fastest way to the data. but as it is with a guess, this may be wrong. i will introduce dynamic sampling in a later post, for now just remember that the optimizer makes some assumptions if no adequate statistics are available.
09:30 am: after two hours you finally finished counting the pages and are able to answer the student’s question: there are 10’000 pages in total. you did quite a lot of work for answering a simple question. lets take a look at what the database does once the optimizer decided how to query the data:
SET AUTOTRACE OFF;
ALTER SYSTEM FLUSH BUFFER_CACHE;
ALTER SESSION SET TRACEFILE_IDENTIFIER = 'select_1';
ALTER SESSION SET EVENTS '10046 trace name context forever, level 8';
SELECT count(pagenumber)
  FROM lordoftherings;
ALTER SESSION SET EVENTS '10046 trace name context forever, level 0';
this will produce a sql trace file which you can find in the trace directory of your database. if you are not sure where to search, ask the database:
show parameter background_dump_dest
I’ll just copy two representative lines here:
WAIT #47691901769152: nam='db file sequential read' ela= 274 file#=3 block#=128 blocks=1 obj#=0 tim=1336672754891155
WAIT #47691901769152: nam='direct path read' ela= 15962 file number=4 first dba=161 block cnt=15 obj#=19241 tim=1336672754908366
these are the two reads the database was performing for answering our question:
- db file sequential read: read one block per I/O request
- direct path read: read multiple blocks per I/O request ( these reads go directly to the pga not to the sga )
don’t be confused because of the “direct path read” and that the blocks do not go to the sga in this case. for the scope of this post it is just important to note that multiple blocks can be read at once. if you ( as the teacher ) are really good in counting pages then you too may be able to count several pages at once. and thats what happens here: because the database needs to read the whole table which results in a full tablescan multiple blocks are read at once. in contrast, if you see “db file sequential read” this is always a single block read.
two hours of work for answering a simple question….
after a short coffee break, at 09:40 the second question comes in: how many pages are there per chapter ?
seems a little bit more complicated as the first question. after thinking about it: oh no. again you need to browse through all the pages very quickly and count those on which you find the chapter’s heading. again, no other option is available for getting the correct answer:
Execution Plan
----------------------------------------------------------
Plan hash value: 3984697483
-------------------------------------------------------------------------------------
| Id  | Operation	   | Name	    | Rows  | Bytes | Cost (%CPU)| Time     |
-------------------------------------------------------------------------------------
|   0 | SELECT STATEMENT   |		    | 11059 |	140K|  2740   (1)| 00:00:33 |
|   1 |  HASH GROUP BY	   |		    | 11059 |	140K|  2740   (1)| 00:00:33 |
|   2 |   TABLE ACCESS FULL| LORDOFTHERINGS | 11059 |	140K|  2739   (1)| 00:00:33 |
-------------------------------------------------------------------------------------
Note
-----
   - dynamic sampling used for this statement (level=2)
11:40 am: another two hours of work. almost noon and time for lunch. but you are able to answer the question: its 50 pages per chapter. you start hating the students for asking stupid questions. it can not go on like this. after sending them to lunch you start thinking on how you will be able do less work while still providing the correct answers. as you already answered two questions you decide to write down the results:
- 10’000 pages in total
- 50 pages per chapter
- 201 chapters in total
these are your first statistics. only three, but better than nothing. this is input you can use for future questions. this does not mean it saves you any of the work, but it may help. in regards to the database this does mean:
exec dbms_stats.gather_table_stats ( USER, 'LORDOFTHERINGS' );
this told the database to create statistics for the table which may help the optimizer with its decisions. lets quickly check what a few of them are at the table level:
SELECT NUM_ROWS
     , BLOCKS
     , AVG_ROW_LEN
  FROM USER_TAB_STATISTICS
 WHERE TABLE_NAME = 'LORDOFTHERINGS';
  NUM_ROWS     BLOCKS AVG_ROW_LEN
---------- ---------- -----------
     10076	10097	     1985
hm. we know for sure that the book consists of 10’000 pages. why does the database report to have 10076 ? this is dependent on the parameter estimate_percent of the gather_table_stats procedure. try to re-gather the statistics with estimate_percent=100 ( which means a hundred percent ) and the numbers will be correct:
exec dbms_stats.gather_table_stats ( USER, 'LORDOFTHERINGS',NULL,100 );
SELECT NUM_ROWS
     , BLOCKS
     , AVG_ROW_LEN
  FROM USER_TAB_STATISTICS
 WHERE TABLE_NAME = 'LORDOFTHERINGS';
  NUM_ROWS     BLOCKS AVG_ROW_LEN
---------- ---------- -----------
     10000	10097	     1966
this is one decision you need to make for your statistic gathering strategy. gather statistics faster, which means a lower estimate percent or give more time and resources for the gathering and get more adequate statistics by using the whole table. in general the defaults should be fine for most environments, but this depends on your database and application.
additionally the database created statistics for the columns of the table:
SELECT COLUMN_NAME
     , NUM_DISTINCT
     , DENSITY
     , NUM_NULLS
  FROM USER_TAB_COL_STATISTICS
 WHERE TABLE_NAME = 'LORDOFTHERINGS';
COLUMN_NAME		       NUM_DISTINCT    DENSITY	NUM_NULLS
------------------------------ ------------ ---------- ----------
PAGENUMBER			      10000	 .0001		0
CHAPTER 				201 .004975124		0
TEXT					  5	    .2		0
this corresponds to the statistics you as a teacher recorded. i will not discuss how this numbers influence the optimizer right now, maybe in later post. just notice there are statistical values right now.
lunch finished, all the students are back to the classroom.
01:00 am, third question: how many pages do just contain the word gandalf ?
damn it. none of the statistics will help you in answering the question. another two hours of work, another time browsing through the whole book.
Execution Plan
----------------------------------------------------------
Plan hash value: 1483287049
------------------------------------------------------------------------------------
| Id  | Operation	  | Name	   | Rows  | Bytes | Cost (%CPU)| Time	   |
------------------------------------------------------------------------------------
|   0 | SELECT STATEMENT  |		   |  2000 |  3828K|  2739   (1)| 00:00:33 |
|*  1 |  TABLE ACCESS FULL| LORDOFTHERINGS |  2000 |  3828K|  2739   (1)| 00:00:33 |
------------------------------------------------------------------------------------
Predicate Information (identified by operation id):
---------------------------------------------------
   1 - filter("TEXT"='GANDALF')
its 03:00 p.m and you are at the point where you really hate the students. and you hate author, too, for writing such a thick book. something must change. you send send the students to get a coffee and start thinking again. a few minutes later you have an idea. once the students are back from coffee you tell them that the class will continue tomorrow but give them some work to do for the remaining two hours: everyone who wants to ask a question shall send it before 08:00 pm so you may prepare for the next day. under no circumstances you will spend two hours for answering a simple question again. home sweet home, take a rest from this frustrating day. at around 09:00 pm ( students are not that in time ) you check your mails for tomorrows questions:
- how many pages just contain the word HOBBIT ?
- how many pages just contain the word HOBBIT or GANDALF
- how many pages in chapter fifty are empty ?
- someone wants to know the page number and chapter for pages where there is the term ring
… and for sure there will be more questions at 10:00 pm
grrr. why do they ask such questions ? none of the question is about the story. ok, that’s life. you can not influence what people like to ask. but, you are smart again, you can recognize the patterns. the first step was to make them think before they ask the questions, so far so good. one step forward. you notice that these people seem to be interested in crazy stuff, like page numbers, single words, the amount of chapters but not in the story. and then you remember: why not create an index for the most common search terms ( columns ) ? wonderful.
CREATE INDEX I_TEXT ON LORDOFTHERINGS(TEXT);
CREATE INDEX I_CHAPTERS ON LORDOFTHERINGS(CHAPTER);
after hours of work you are finished with the indexes and go to sleep. you should be prepared for the crazy students tomorrow. some dreams ( fights against horrible page numbers, chapters and small hobbits ) later, you take your morning coffee and go to the classroom. ok, students…..
07:00 am ( in time this morning ): first question: how many pages just contain the word HOBBIT ?
hah, easy. just go to the index and count:
Execution Plan
----------------------------------------------------------
Plan hash value: 2876191354
-----------------------------------------------------------------------------------
| Id  | Operation	 | Name 	  | Rows  | Bytes | Cost (%CPU)| Time	  |
-----------------------------------------------------------------------------------
|   0 | SELECT STATEMENT |		  |  2000 |  3828K|   987   (0)| 00:00:12 |
|*  1 |  INDEX RANGE SCAN| I_SINGLE_WORDS |  2000 |  3828K|   987   (0)| 00:00:12 |
-----------------------------------------------------------------------------------
Predicate Information (identified by operation id):
---------------------------------------------------
   1 - access("TEXT"='HOBBIT')
07:05 am: five minutes later you are able to provide the correct the answer. this will be a short day.
07:06 am: second question: how many pages just contain the word HOBBIT or GANDALF
Execution Plan
----------------------------------------------------------
Plan hash value: 2888173227
---------------------------------------------------------------------------------------
| Id  | Operation	     | Name	      | Rows  | Bytes | Cost (%CPU)| Time     |
---------------------------------------------------------------------------------------
|   0 | SELECT STATEMENT     |		      |  4000 |  7656K|  1329	(1)| 00:00:16 |
|*  1 |  INDEX FAST FULL SCAN| I_SINGLE_WORDS |  4000 |  7656K|  1329	(1)| 00:00:16 |
---------------------------------------------------------------------------------------
Predicate Information (identified by operation id):
---------------------------------------------------
   1 - filter("TEXT"='GANDALF' OR "TEXT"='HOBBIT')
pff, another five minutes later you can answer the question. this will be a very short day. indexes are the solution.
07:15 am: third question: how many pages in chapter fifty are empty ?
Execution Plan
----------------------------------------------------------
Plan hash value: 1881835047

-----------------------------------------------------------------------------------------------
| Id  | Operation		     | Name	      | Rows  | Bytes | Cost (%CPU)| Time     |
-----------------------------------------------------------------------------------------------
|   0 | SELECT STATEMENT	     |		      |     1 |  1964 |    51	(0)| 00:00:01 |
|   1 |  SORT AGGREGATE 	     |		      |     1 |  1964 | 	   |	      |
|*  2 |   TABLE ACCESS BY INDEX ROWID| LORDOFTHERINGS |     1 |  1964 |    51	(0)| 00:00:01 |
|*  3 |    INDEX RANGE SCAN	     | I_CHAPTERS     |    50 |       |     1	(0)| 00:00:01 |
-----------------------------------------------------------------------------------------------
thanks to the chapter index you only have to look at the pages for chapter fifty. this speeds up your work, and ten minutes later you’re finished. you love indexes. because you feel wonderful and because you do not hate the students anymore you decide to do a coffee break. because of the work you spend on building the indexes there is no time pressure anymore.
08:30 am: fourth question: someone wants to know the page number and chapter for pages where there is the term ring ?
easy, you have the index. you take a look at the index, pick the first reference, go to the page in book and note the chapter and the page number. back to the index, pick the next reference, open the bock at the page the index tells you, note the chapter and the page number….
back to the index, pick the next reference, open the bock at the page the index tells you, note the chapter and the page number…
back to the index, pick the next reference, open the bock at the page the index tells you, note the chapter and the page number…
back to the index, pick the next reference, open the bock at the page the index tells you, note the chapter and the page number…
back to the index, pick the next reference, open the bock at the page the index tells you, note the chapter and the page number…
back to the index, pick the next reference, open the bock at the page the index tells you, note the chapter and the page number…
back to the index, pick the next reference, open the bock at the page the index tells you, note the chapter and the page number…
you start to realize that this will take a whole bunch of time. you even notice that this will take longer than scanning the whole book. how can this be ? you spend so much work in creating the index and now the index is no help at all. the problem is: for every entry in the index you have to go to the book and open the page the index points to. that is at least two reads. one for the index, one for the page in book. you remember the statistics you wrote down above: there a five distinct values for the text, so it should be around 2’000 pages to scan ( you don’t know right now that it actually are 5’000 ). as the term ring seems to present on every fifth page that would be at least 2’000×2 reads, one index read, one page read for every index entry, puh.
that’s not going to be fast. it will be faster to scan the whole book ( remember that you are able to scan very fast, multiple book pages at a time ) so your decision is: do a full scan of the book.
lets see what the database does:
SET AUTOTRACE TRACEONLY;
SELECT pagenumber,chapter
  FROM lordoftherings
 WHERE text = 'RING';
Execution Plan
----------------------------------------------------------
Plan hash value: 1483287049
------------------------------------------------------------------------------------
| Id  | Operation	  | Name	   | Rows  | Bytes | Cost (%CPU)| Time	   |
------------------------------------------------------------------------------------
|   0 | SELECT STATEMENT  |		   |  2000 |  3839K|  2739   (1)| 00:00:33 |
|*  1 |  TABLE ACCESS FULL| LORDOFTHERINGS |  2000 |  3839K|  2739   (1)| 00:00:33 |
------------------------------------------------------------------------------------
Predicate Information (identified by operation id):
---------------------------------------------------
   1 - filter("TEXT"='RING')
exactly the same. as the database is able to scan multiple blocks at a time when using a full table scan this will be faster than processing the index and visiting the table for every pointer in the index. note that the guess of 2’000 rows in total in the above plan is far from being correct, the correct answer is 5’000 ( more on that in a later post ).
you manage to answer the question just before noon. you decide to close the class and give the students a free afternoon. that has been to much work and you are frustrated. very, very simple questions and you have not been able to answer some questions in a reasonable time.
in the evening, because you are ambitious, you decide to write down what you learned from the one and half days. perhaps this is helpful for the other teacher:
- always tell the students to think about what they want to know and write down the questions in advance
- indexes may be useful if there are not to many references to the search term wich point you to a lot of different pages in the book
- scanning a whole book seems to be fast, in regards to I/O, as you are able to scan multiple pages a time
- index scans which require you to read the page in the book are, in regards to I/O, much slower as it requires at least two reads and each read can process only one page
- statistics help in making decisions, but statistics might be wrong and therefore might drive you to the wrong direction
- some parts of the book, probably the ones you read over and over again, stay in the brain, so you may answer repeated questions without reading the book
time to go to sleep …..


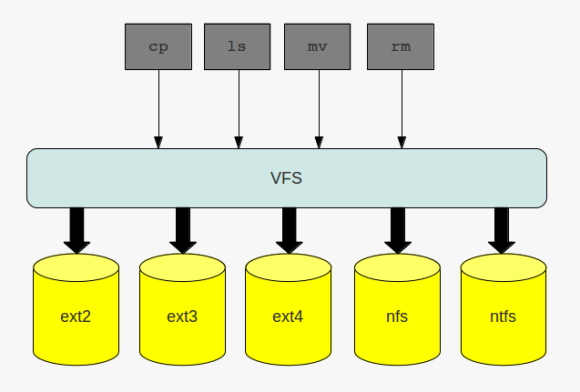 the virtual file system
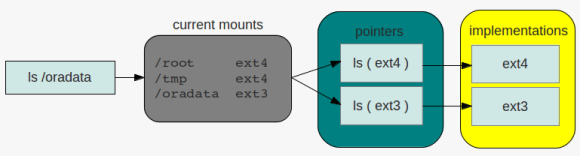 directory listing
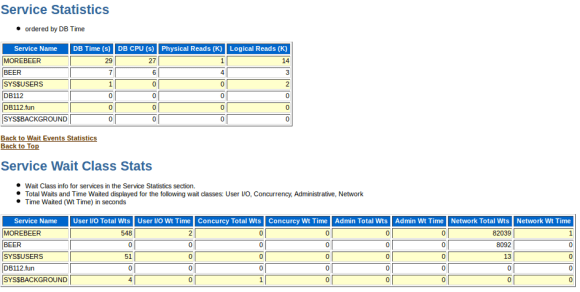 service stats in awr
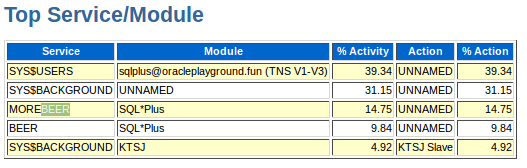 service stats in ash
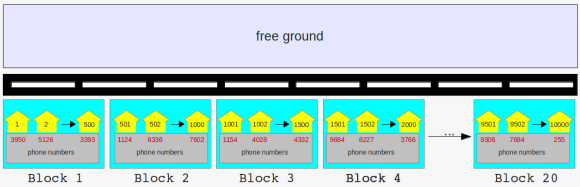 long street with tiny houses, grouped into blocks
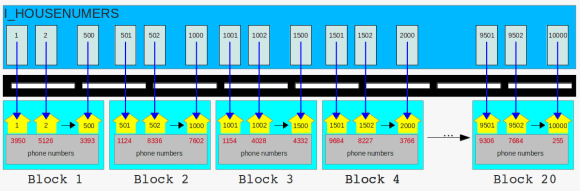 the houses got new neighbors
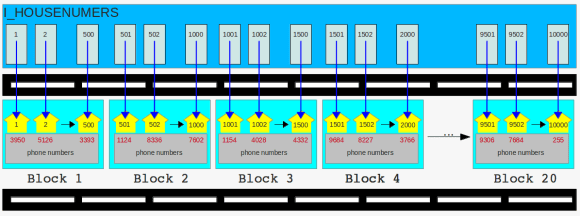 the new road is ready
 more neighbors
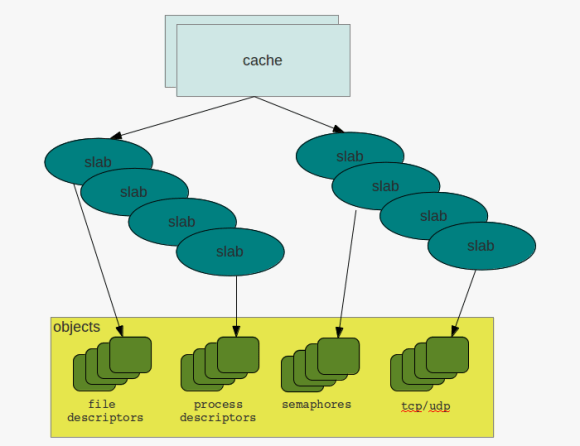 caches & slabs
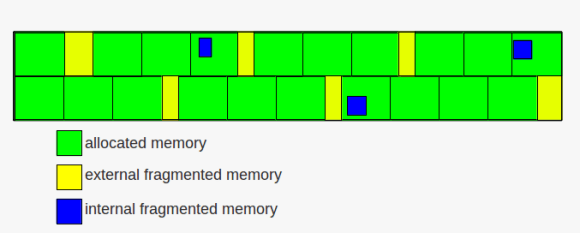 memory fragmentation