if you followed the oracle installation guide there are some kernel parameters to be configured for the oracle database. one of them specified by four values is about semaphores:

  • semmsl: the maximum number of semaphores per semaphore set
  • semmns: the maximum number of semaphore of the entire system
  • semopm: number of maximum operations per semop call
  • semmni: the maximum number of semaphore sets of the entire system

the question is: what are these semaphores about and what are they for?


a semaphore is a counter associated with a data structure which provides locking and synchronization of critical regions. there is one semaphore ( initialized to 1 ) for each data structure to be protected. the atomic methods “down” and “up” are used to decrease and increase the counter. if the kernel wants access to a protected structure it executes the “down” method and if the result is not negative ( the counter is equal or greater than zero ) access to the resource is granted. if the counter is negative the process which wishes to access the resource is blocked and added to the sempahore list ( a kind of queue ). as time goes by some process finishes its work and executes the “up” method which allows one process in the semaphore list to proceed.

in linux there are two kinds of semaphores:

  • kernel semaphores ( for kernel control paths )
  • system V IPC semaphores ( for user mode processes ), IPC stands for “interprocess communication”

the IPC semaphores are the ones relevant to the oracle database. semaphores are created by the function semget() which returns the semaphore identifier. there are two other functions for creating ipc resources, which are:

  • msgget(): which is for message queues
  • shmget(): which is for shared memory

there must be at least one semaphore for each oracle process ( the processes parameter of the database ). as each session to the database needs to be synchronized with other sessions ( and sessions are memory structures ) oracle must request resources from the operation system to be able to handle concurrency in the sga to which all sessions are connected to.

the semaphores queue of pending requests is implemented as a double linked list. you remember? the same concepts over and over again. actually semaphores are sometimes called mutexes ( and there are internal functions like init_MUTEX )… surprised ?

to display the current limits the following command can be used:

ipcs -ls
------ Semaphore Limits --------
max number of arrays = 1024
max semaphores per array = 250
max semaphores system wide = 32000
max ops per semop call = 32
semaphore max value = 32767

or you can directly query the /proc filesystem:

cat /proc/sys/kernel/sem
250 32000 32 1024

to check the currently allocated semaphores:

ipcs -s
------ Semaphore Arrays --------
key semid owner perms nsems
0x127f81f8 163842 oracle 640 124
0x3d2c0d44 1933315 oracle 640 129
0x3d2c0d45 1966084 oracle 640 129
0x3d2c0d46 1998853 oracle 640 129
0x3d2c0d47 2031622 oracle 640 129
0x3d2c0d48 2064391 oracle 640 129

if you want to see some semaphore operations in action do, for example, a strace on the smon process and wait one or two seconds:

ps -ef | grep dbw
oracle 2723 1 0 08:31 ? 00:00:03 ora_smon_dbs300
root 3153 3111 2 09:04 pts/1 00:00:00 grep smon
strace -p 2723
...
semtimedop(819203, {{17, -1, 0}}, 1, {3, 0}) = -1 EAGAIN (Resource temporarily unavailable)
gettimeofday({1333697562, 861932}, NULL) = 0
semtimedop(819203, {{17, -1, 0}}, 1, {3, 0}) = -1 EAGAIN (Resource temporarily unavailable)
gettimeofday({1333697565, 871767}, NULL) = 0
semtimedop(819203, {{17, -1, 0}}, 1, {3, 0}) = -1 EAGAIN (Resource temporarily unavailable)
gettimeofday({1333697568, 893455}, NULL) = 0
semtimedop(819203, {{17, -1, 0}}, 1, {3, 0}) = -1 EAGAIN (Resource temporarily unavailable)
gettimeofday({1333697571, 905050}, NULL) = 0
semtimedop(819203, {{17, -1, 0}}, 1, {3, 0}) = -1 EAGAIN (Resource temporarily unavailable)
gettimeofday({1333697574, 920094}, NULL) = 0
...

here you can clearly see calls to semtimedop which return with -1 ( EAGAIN, the call expired ).

if you followed the series on how to setup a test infrastructure or you have a test infrastructure available to play with here is a little demonstration:

be sure to save your current kernel semaphore settings:

cat /proc/sys/kernel/sem
250 32000 32 1024

minimize the settings to very low values and try to restart ( or start ) the oracle instance:

su-
echo "2 10 1 2" > /proc/sys/kernel/sem

if you write the values to the /proc/sys/kernel/…-parameter files the values will be in effect immediately. be sure what you are doing if you’re touching these parameters.

startup or restart the oracle instance:

su - oracle
sqlplus / as sysdba
startup force
ORA-27154: post/wait create failed
ORA-27300: OS system dependent operation:semget failed with status: 28
ORA-27301: OS failure message: No space left on device
ORA-27302: failure occurred at: sskgpbitsper

what happened ? the database was not able to allocate the resources ( sempahores ) it needs, thus can not start up. the message “No space left on device” indicates some issue with disk space, but it’s actually the memory in question here. fyi: the allocation of semaphores ( and shared memory ) does only occur during the “startup nomount” phase. this is the only time oracle requests this resources.

fix it, and try again:

su -
echo "250 32000 32 1024" > /proc/sys/kernel/sem
su - oracle
startup force

conclusion: semaphores are one critical part for interprocess communication and provide a way for locking and synchronization. if the database can not allocate the resources it needs from the operating system it will fail to start up.

the values recommended in the installation guides are minimum values. if your session count to the database grows you may need to adjust the semaphore parameters.
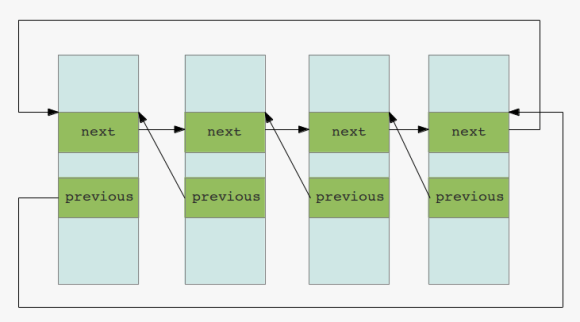
when it comes to the management of processes and data structures there is one essential concept: double linked lists

you can think of this concept as n lists ( memory structures ) linked together each containing pointers to the next and to the previous list:

double linked lists

from the perspective of the linux kernel this lists help, for example, in tracking all the processes in the system. if it comes to the oracle database there is the same concept. all the caches and pools are based on double linked lists.

one place where you can see that oracle uses the same concept is the buffer headers. although you can not see it in v$bh oracle exposes the information in the underlying x$bh:

SQL> select NXT_REPL,PRV_REPL from x$bh where rownum < 5;
NXT_REPL PRV_REPL
-------- --------
247E550C 247E535C
23BE334C 23BE319C
23BF38DC 23BF372C
22FE694C 22FE679C

these are some pointers to the next and previous lists mentioned above. you can even check the relations:

SQL> select NXT_REPL,PRV_REPL from x$bh where NXT_REPL = '23BF38DC' or PRV_REPL = '23BF38DC';
NXT_REPL PRV_REPL
-------- --------
23BF38DC 23BF372C
23BF3A8C 23BF38DC

for managing these lists there must be some atomic ( notice the vocabulary, it’s the same as the A in ACID ) operations implemented:

  • initialize the list
  • inserting and deleting elements
  • walking through the list for finding an element
  • checking for empty elements in the list

the list of processes in linux is called the process list. this list links together all the processes in the system, more exactly: it links together all the process descriptors. if the kernel wants to know which processes are ready to run, it scans the list for all processes in state TASK_RUNNING. there are several others states a process can be in:

  • TASK_RUNNING: the process waits to be executed or currently is executing
  • TASK_INTERRUPTIBLE: the process sleeps until some event occurs
  • TASK_UNINTERRUPTIBLE: the process sleeps and will not wake up on a signal
  • TASK_STOPPED: the process is stopped
  • TASK_TRACED: the process is being traced

when one process creates one or more other processes there are one or more parent/child relationships. this relationships are present in the process descriptors. the init process ( which is pid 1 ) is the master ( or the anchor ) of all other processes. all this relations are managed by linked lists.

for the kernel to quickly find an entry in one of the lists another concept is introduced: hashing. hashing data is an efficient way to locate an element in a list. for example the number 85 might hash to the 10th entry of a list ( so after hashing the kernel can jump directly to this entry instead of scanning the whole list for the value in question ). this is another link to the oracle database as oracle is excessively using hashing, too ( for example to quickly locate sql-statements in the shared pool oracle hashes the text of the statement ).

you probably heard of locks in the oracle world. next link between the os and the database. when elements of lists are modified there is a need to protect them from concurrent access. imagine what happens if two ( or more ) processes try to modify the same data at the same time. this is where locks come into play: locks provide a mechanism for synchronization. in the linux kernels wait queues, for example, there are exclusive processes and nonexclusive processes. the latter are always woken up by the kernel if some specific events occur while the exclusive processes are woken up selectively ( for example if they want to access a resource only one processes can be granted to at a time ). again, you see same vocabulary here than in the oracle database world: there are exclusive locks, shared locks, etc.

by the way: keeping the duration of the locks as short as possible without risking data inconsistency is one key to performance. because if there are locks there is very good chance that others have to wait until the locks disappear ( and waiting is wasted time in terms of performance ). this is why mutexes appeared in the oracle database: they provide a faster way of protecting data than the traditional latches ( which are a kind of lock in the oracle database ).

conclusion: if you understand how the operating system handles resources it is not a big deal to understand some basic workings of the database. much is about double linked lists and protecting data. even the vocabulary is the same very often. you see the same terms over and over again ( queues, locks, spins, lists, waits …. ).

if you want to go into more detail on how oracle handles lists, check out james morle’s book scalingoracle8i which is available for download now. don’t care about the 8i, the basics are still the same.

happy listing …

this post will continue the introduction post to linux processes and shows how the listener handles connection requests to the database.

let’s check the listeners pid:

ps -ef | grep tns
grid 2646 1 0 10:47 ? 00:00:03 /opt/oracle/product/base/11.2.0.3/bin/tnslsnr LISTENER_DB112 -inherit

as the listener needs to handle connections there must be some sorts of open files for the listener process:

[root@oracleplayground ~]# ls -la /proc/2646/fd/
total 0
dr-x------ 2 grid oinstall 0 Apr 4 10:47 .
dr-xr-xr-x 6 grid oinstall 0 Apr 4 10:47 ..
lrwx------ 1 grid oinstall 64 Apr 4 15:29 0 -> /dev/null
lrwx------ 1 grid oinstall 64 Apr 4 15:29 1 -> /dev/null
lrwx------ 1 grid oinstall 64 Apr 4 15:29 10 -> socket:[7875]
lrwx------ 1 grid oinstall 64 Apr 4 15:29 11 -> socket:[7877]
lrwx------ 1 grid oinstall 64 Apr 4 15:29 12 -> socket:[7949]
lrwx------ 1 grid oinstall 64 Apr 4 15:29 13 -> socket:[7950]
lrwx------ 1 grid oinstall 64 Apr 4 15:29 15 -> socket:[12719]
lrwx------ 1 grid oinstall 64 Apr 4 15:29 2 -> /dev/null
lr-x------ 1 grid oinstall 64 Apr 4 15:29 3 -> /opt/oracle/product/base/11.2.0.3/rdbms/mesg/diaus.msb
lr-x------ 1 grid oinstall 64 Apr 4 15:29 4 -> /proc/2646/fd
lr-x------ 1 grid oinstall 64 Apr 4 15:29 5 -> /opt/oracle/product/base/11.2.0.3/network/mesg/nlus.msb
lr-x------ 1 grid oinstall 64 Apr 4 15:29 6 -> pipe:[7822]
lr-x------ 1 grid oinstall 64 Apr 4 15:29 7 -> /opt/oracle/product/base/11.2.0.3/network/mesg/tnsus.msb
lrwx------ 1 grid oinstall 64 Apr 4 15:29 8 -> socket:[7873]
l-wx------ 1 grid oinstall 64 Apr 4 15:29 9 -> pipe:[7823]
[root@oracleplayground ~]# 

this tells us that the listener has 15 open file descriptors of which 8,10-15 are sockets and 9 is a pipe.

let’s request a connection to the database through the listener and trace the listener process in parallel:

Session 1 ( as root ):

strace -p 2646

Session 2 ( as oracle ):

sqlplus a/a@DB112

the strace output ( i have number the lines ) should look similar to this:

1: poll([{fd=8, events=POLLIN|POLLRDNORM}, {fd=11, events=POLLIN|POLLRDNORM}, {fd=12, events=POLLIN|POLLRDNORM}, {fd=13, events=POLLIN|POLLRDNORM}, {fd=15, events=POLLIN|POLLRDNORM}, {fd=-1}, {fd=-1}], 7, -1) = 1 ([{fd=13, revents=POLLIN|POLLRDNORM}])
2: times({tms_utime=76, tms_stime=325, tms_cutime=0, tms_cstime=1}) = 431191568
3: getsockname(13, {sa_family=AF_INET, sin_port=htons(1521), sin_addr=inet_addr("127.0.0.1")}, [11087335753955409936]) = 0
4: getpeername(13, 0x7fffc6b5d1a8, [11087335753955409936]) = -1 ENOTCONN (Transport endpoint is not connected)
5: accept(13, {sa_family=AF_INET, sin_port=htons(23139), sin_addr=inet_addr("127.0.0.1")}, [68719476752]) = 14
6: getsockname(14, {sa_family=AF_INET, sin_port=htons(1521), sin_addr=inet_addr("127.0.0.1")}, [68719476752]) = 0
7: fcntl(14, F_SETFL, O_RDONLY|O_NONBLOCK) = 0
8: getsockopt(14, SOL_SOCKET, SO_SNDBUF, [-4128159149999471140], [4]) = 0
9: getsockopt(14, SOL_SOCKET, SO_RCVBUF, [-4128159149999434336], [4]) = 0
10: setsockopt(14, SOL_TCP, TCP_NODELAY, [1], 4) = 0
11: fcntl(14, F_SETFD, FD_CLOEXEC) = 0
12: times({tms_utime=76, tms_stime=325, tms_cutime=0, tms_cstime=1}) = 431191568
13: rt_sigaction(SIGPIPE, {0x1, ~[ILL ABRT BUS FPE SEGV USR2 XCPU XFSZ SYS RTMIN RT_1], SA_RESTORER|SA_RESTART|SA_SIGINFO, 0x32e840ebe0}, {0x1, ~[ILL ABRT BUS FPE KILL SEGV USR2 STOP XCPU XFSZ SYS RTMIN RT_1], SA_RESTORER|SA_RESTART|SA_SIGINFO, 0x32e840ebe0}, 8) = 0
14: times({tms_utime=76, tms_stime=325, tms_cutime=0, tms_cstime=1}) = 431191568
15: times({tms_utime=76, tms_stime=325, tms_cutime=0, tms_cstime=1}) = 431191568
16: poll([{fd=8, events=POLLIN|POLLRDNORM}, {fd=11, events=POLLIN|POLLRDNORM}, {fd=12, events=POLLIN|POLLRDNORM}, {fd=13, events=POLLIN|POLLRDNORM}, {fd=15, events=POLLIN|POLLRDNORM}, {fd=14, events=POLLIN|POLLRDNORM}, {fd=-1}], 7, 60000) = 1 ([{fd=14, revents=POLLIN|POLLRDNORM}])
17: read(14, "\335\1\1:\1,\fA \377\377\177\10\1\243:\10"..., 8208) = 221
18: fcntl(14, F_GETFL) = 0x802 (flags O_RDWR|O_NONBLOCK)
19: fcntl(14, F_SETFL, O_RDWR) = 0
20: times({tms_utime=76, tms_stime=325, tms_cutime=0, tms_cstime=1}) = 431191569
21: fcntl(14, F_SETFD, 0) = 0
22: pipe([16, 17]) = 0
23: pipe([18, 19]) = 0
24: clone(child_stack=0, flags=CLONE_CHILD_CLEARTID|CLONE_CHILD_SETTID|SIGCHLD, child_tidptr=0x2ac09be5bb80) = 5894
25: wait4(5894, [{WIFEXITED(s) && WEXITSTATUS(s) == 0}], 0, NULL) = 5894
26: close(16) = 0
27: close(19) = 0
28: fcntl(18, F_SETFD, FD_CLOEXEC) = 0
29: fcntl(17, F_SETFD, FD_CLOEXEC) = 0
30: fcntl(14, F_SETFD, FD_CLOEXEC) = 0
31: poll([{fd=8, events=POLLIN|POLLRDNORM}, {fd=11, events=POLLIN|POLLRDNORM}, {fd=12, events=POLLIN|POLLRDNORM}, {fd=13, events=POLLIN|POLLRDNORM}, {fd=15, events=POLLIN|POLLRDNORM}, {fd=18, events=POLLIN|POLLRDNORM}, {fd=17, events=0}], 7, -1) = 1 ([{fd=18, revents=POLLIN|POLLRDNORM}])
32: read(18, "NTP0 5895\n", 64) = 10
33: write(17, ";", 4) = 4
34: write(17, "(ADDRESS=(PROTOCOL=tcp)(DEV=14)("..., 59) = 59
35: write(17, "\1\4", 8) = 8
36: read(18, "", 4) = 4
37: read(18, "*1", 4) = 4
38: write(14, "\10\v", 8) = 8
39: close(17) = 0
40: close(18) = 0
41: close(14) = 0
42: lseek(7, 19968, SEEK_SET) = 19968
43: read(7, "\f005\4P006\4j007\4\206008\4\240009\4\335"..., 512) = 512
44: poll([{fd=8, events=POLLIN|POLLRDNORM}, {fd=11, events=POLLIN|POLLRDNORM}, {fd=12, events=POLLIN|POLLRDNORM}, {fd=13, events=POLLIN|POLLRDNORM}, {fd=15, events=POLLIN|POLLRDNORM}, {fd=-1}, {fd=-1}], 7, -1) = 1 ([{fd=15, revents=POLLIN|POLLRDNORM}])
45: Process 2646 detached

a lot of cryptic output, isn’t it? let’s take a closer look on what’s happening:

on line one you can see a call to “poll”. poll waits for some events on the file descriptors. as connections are files, you may say it waits for some sort of connections.

on line two you can see a call to times, which returns several process times.

on line three there is a call to getsockname which returns the socket name for this address: {sa_family=AF_INET, sin_port=htons(1521), sin_addr=inet_addr(“127.0.0.1”)}, which is
the listener on port 1521 ( sa_family: this is the address family, AF_INET is the one used for IP, sin_port: is the port, sin_addr: is the address, in this case localhost ).

the call on line four ( getpeername ) does what it is called: get the name of the connected peer. it returns with ENOTCONN ( the socket is not connected ). next, one line five, a connection to the socket is accepted. notice that a new file descriptor is created ( 14 ) and passed to the getsockname call on line six. getsockname returns with code 0, which is success. now there is a connected endpoint which is our request to the listener.

the call to fcntl on line 7 modifies the file descriptor: set the file status flags ( F_SETFL ) to read only ( O_RDONLY ) and block system calls ( O_NONBLOCK ).

on line 8 and 9 the values of the sockets receive and sent buffers are read and on line 10 the TCP option TCP_NODELAY ( which disables Nagle’s algorithm ) is set.

next, on line 11, the socket is modified to close when a call to an exec function is performed. from now on I will ignore the calls to times, as I have described it above.

on line 13 rt_sigaction changes the action taken by the process on receipt of a signal and line 17 reads from the file associated with the file
descriptor ( ignore line 14,15,16 ). line 18 again reads the file descriptor flags and line 19 sets the flag for read/write ( O_RDWR ) and line 21
resets the file descriptor flags to the defaults.

line 22 and 23 create a pair of file descriptors pointing to a pipe inode ( the first is for reading, the second for writing ). the clone call on line 24 does interesting stuff, it creates a new process with is 5894 and line 25 waits for the new process to change its state ( the child_stack=0 indicates that a process is created, not a thread ), in other words it waits for the process to exit.

if we now do a check if the process is there, you will notice that no process with this PID exists ( this is probably because it is the PID of the clone itself ):

ps -ef | grep 5894
root 5984 5611 0 15:58 pts/3 00:00:00 grep 5894

but what exists, is PID+1 ( which you can see on line 32 ):

ps -ef | grep 5895
oracle 5895 1 0 15:44 ? 00:00:00 oracleDB112 (LOCAL=NO)
root 5997 5611 0 16:00 pts/3 00:00:00 grep 5895

… which is our connection to the database. if you check this process you will see that the socket 14 is now available in the newly created process:

ls -la /proc/5895/fd
total 0
dr-x------ 2 root root 0 Apr 4 15:44 .
dr-xr-xr-x 6 oracle asmadmin 0 Apr 4 15:44 ..
lr-x------ 1 root root 64 Apr 4 16:00 0 -> /dev/null
l-wx------ 1 root root 64 Apr 4 16:00 1 -> /dev/null
lrwx------ 1 root root 64 Apr 4 16:00 14 -> socket:[102504]
l-wx------ 1 root root 64 Apr 4 16:00 2 -> /dev/null
lr-x------ 1 root root 64 Apr 4 16:00 3 -> /dev/null
lr-x------ 1 root root 64 Apr 4 16:00 4 -> /dev/null
lr-x------ 1 root root 64 Apr 4 16:00 5 -> /opt/oracle/product/base/11.2.0.3/rdbms/mesg/oraus.msb
lr-x------ 1 root root 64 Apr 4 16:00 6 -> /proc/5895/fd
lr-x------ 1 root root 64 Apr 4 16:00 7 -> /dev/zero

the remaining lines will close some files ( including the listeners file descriptor 14 ) and write some data. i will ignore the rest of the output as it should be clear now, how the listener hands off the connections to the database: it listens to incoming requests on the defined port and creates a new process which is the database connection. that’s all the listener does. once the connection is established there is no more work to do for the listener and it looses control of the newly created process.

just one more thing of interest: the lseek and read calls to file descriptor 7 ( lines 42 and 43 ) are positioning and reading the file containing the tns messages. you can check this with:

strings /opt/oracle/product/base/11.2.0.3/network/mesg/tnsus.msb

this are the messages the listener returns.

happy listening …

as mentioned in earlier posts as a dba you need to know how the operating system works. this post is an introduction to processes on linux.

the definition of process is: a process is an instance of a program in execution.
to manage a process the linux kernel must know a lot of things about the process, e.g. which files the process is allowed to handle, if it is running on CPU or blocked, the address space of the process etc. all this information is present in the so called process descriptor. you can think of the process descriptor as a strcuture containing all the information the kernel needs to know about the process ( internally the structure is called: task_structure ). on of the information stored in the process descriptor is the process id which is used to identify the process.

let’s take a look at the processes that make up the oracle database:

ps -ef | grep $ORACLE_SID | egrep -v "DESCRIPTION|grep|tnslsnr" 
oracle    2944     1  0 08:30 ?        00:00:03 ora_pmon_DB112
oracle    2946     1  0 08:30 ?        00:00:06 ora_psp0_DB112
oracle    2948     1  2 08:30 ?        00:01:11 ora_vktm_DB112
oracle    2952     1  0 08:30 ?        00:00:02 ora_gen0_DB112
oracle    2954     1  0 08:30 ?        00:00:03 ora_diag_DB112
oracle    2956     1  0 08:30 ?        00:00:02 ora_dbrm_DB112
oracle    2958     1  0 08:30 ?        00:00:06 ora_dia0_DB112
oracle    2961     1  0 08:30 ?        00:00:02 ora_mman_DB112
oracle    2963     1  0 08:30 ?        00:00:03 ora_dbw0_DB112
oracle    2965     1  0 08:30 ?        00:00:03 ora_lgwr_DB112
oracle    2967     1  0 08:30 ?        00:00:06 ora_ckpt_DB112
oracle    2969     1  0 08:30 ?        00:00:01 ora_smon_DB112
oracle    2971     1  0 08:30 ?        00:00:00 ora_reco_DB112
oracle    2973     1  0 08:30 ?        00:00:02 ora_rbal_DB112
oracle    2975     1  0 08:30 ?        00:00:01 ora_asmb_DB112
oracle    2977     1  0 08:30 ?        00:00:05 ora_mmon_DB112
oracle    2979     1  0 08:30 ?        00:00:09 ora_mmnl_DB112
oracle    2987     1  0 08:30 ?        00:00:04 ora_mark_DB112
oracle    3013     1  0 08:30 ?        00:00:00 ora_qmnc_DB112
oracle    3054     1  0 08:30 ?        00:00:01 ora_q000_DB112
oracle    3056     1  0 08:30 ?        00:00:00 ora_q001_DB112
oracle    3182     1  0 08:35 ?        00:00:02 ora_smco_DB112
oracle    3359     1  0 09:05 ?        00:00:00 ora_w000_DB112

notice that the grep command excluded the listener process and all the current connections to the database.
if you want to check the local connections connections to the database from the os, you can do something like this:

ps -ef | grep $ORACLE_SID | grep "LOCAL=YES"
oracle    2933     1  0 10:48 ?        00:00:01 oracleDB112 (DESCRIPTION=(LOCAL=YES)(ADDRESS=(PROTOCOL=beq)))
oracle    2969     1  0 10:48 ?        00:00:00 oracleDB112 (DESCRIPTION=(LOCAL=YES)(ADDRESS=(PROTOCOL=beq)))
oracle    2979     1  0 10:48 ?        00:00:00 oracleDB112 (DESCRIPTION=(LOCAL=YES)(ADDRESS=(PROTOCOL=beq)))
oracle    3088  3087  0 10:50 ?        00:00:00 oracleDB112 (DESCRIPTION=(LOCAL=YES)(ADDRESS=(PROTOCOL=beq)))
oracle    3096     1  0 10:50 ?        00:00:00 oracleDB112 (DESCRIPTION=(LOCAL=YES)(ADDRESS=(PROTOCOL=beq)))

checking the processes from inside the database would be as simple as this ( for the background processes ):

SQL> select pname from v$process where pname is not null;
PNAME
-----
PMON
PSP0
VKTM
GEN0
DIAG
DBRM
DIA0
MMAN
DBW0
LGWR
CKPT
SMON
RECO
RBAL
ASMB
MMON
MMNL
MARK
SMCO
W000
QMNC
Q000
Q001

with the above arguments ( -ef ) supplied to the ps command, the columns displayed are:

  • the os-user the process runs under
  • the process id
  • the parent process id
  • processor utilization
  • start time of the process
  • the terminal the process was started on ( if any )
  • the cumulative CPU time
  • the command

but where does the ps command get the information to display from ? in fact you can get all of the information displayed above without using the ps command. all you need to do is to check the pseudo filesystem /proc ( it is called a pseudo filesystem because it is a virtual filesystem that maps to the kernel structures ).

if you do a “ls” on the proc filesystem you’ll see a lot of directories and files. for this post we will concentrate on the numbered directories which map to process ids.

let’s take smon as an example, which is the oracle system monitor ( you will need to adjust the process-id for your environment ):

ls -la /proc/2969/
dr-xr-xr-x   6 oracle asmadmin 0 Apr  3 13:40 .
dr-xr-xr-x 154 root   root     0 Apr  3  2012 ..
dr-xr-xr-x   2 oracle asmadmin 0 Apr  3 14:07 attr
-r--------   1 root   root     0 Apr  3 14:07 auxv
-r--r--r--   1 root   root     0 Apr  3 13:45 cmdline
-rw-r--r--   1 root   root     0 Apr  3 14:07 coredump_filter
-r--r--r--   1 root   root     0 Apr  3 14:07 cpuset
lrwxrwxrwx   1 root   root     0 Apr  3 14:07 cwd -> /opt/oracle/product/base/11.2.0.3/dbs
-r--------   1 root   root     0 Apr  3 14:07 environ
lrwxrwxrwx   1 root   root     0 Apr  3 14:07 exe -> /opt/oracle/product/base/11.2.0.3/bin/oracle
dr-x------   2 root   root     0 Apr  3 13:40 fd
dr-x------   2 root   root     0 Apr  3 14:07 fdinfo
-r--------   1 root   root     0 Apr  3 14:07 io
-r--r--r--   1 root   root     0 Apr  3 14:07 limits
-rw-r--r--   1 root   root     0 Apr  3 14:07 loginuid
-r--r--r--   1 root   root     0 Apr  3 13:40 maps
-rw-------   1 root   root     0 Apr  3 14:07 mem
-r--r--r--   1 root   root     0 Apr  3 14:07 mounts
-r--------   1 root   root     0 Apr  3 14:07 mountstats
-r--r--r--   1 root   root     0 Apr  3 14:07 numa_maps
-rw-r--r--   1 root   root     0 Apr  3 14:07 oom_adj
-r--r--r--   1 root   root     0 Apr  3 14:07 oom_score
lrwxrwxrwx   1 root   root     0 Apr  3 14:07 root -> /
-r--r--r--   1 root   root     0 Apr  3 14:07 schedstat
-r--r--r--   1 root   root     0 Apr  3 14:07 smaps
-r--r--r--   1 root   root     0 Apr  3 13:40 stat
-r--r--r--   1 root   root     0 Apr  3 14:07 statm
-r--r--r--   1 root   root     0 Apr  3 13:45 status
dr-xr-xr-x   3 oracle asmadmin 0 Apr  3 14:07 task
-r--r--r--   1 root   root     0 Apr  3 14:07 wchan

what do we see here? lots and lots of information of the smon process. for a detailed description of what all the files and directories are about, you can go to the man-pages:

man proc

for example, if we take a look at the statm file of the process:

cat /proc/2969/statm
126385 16013 14717 45859 0 994 0

… and check the man pages for the meaning of the numbers, things are getting clearer:

/proc/[number]/statm
      Provides information about memory status in pages.  The columns are:
               size       total program size
               resident   resident set size
               share      shared pages
               text       text (code)
               lib        library
               data       data/stack
               dt         dirty pages (unused in Linux 2.6)

wanting to know the environment of the process? just take a look at the environ file:

cat /proc/2969/environ 
__CLSAGFW_TYPE_NAME=ora.listener.typeORA_CRS_HOME=/opt/oracle/product/crs/11.2.0.3SELINUX_INIT=YESCONSOLE=/dev/consoleTERM=linuxSHELL=/bin/bash__CRSD_CONNECT_STR=(ADDRESS=(PROTOCOL=IPC)(KEY=OHASD_IPC_SOCKET_11))NLS_LANG=AMERICAN_AMERICA.AL32UTF8CRF_HOME=/opt/oracle/product/crs/11.2.0.3GIPCD_PASSTHROUGH=false__CRSD_AGENT_NAME=/opt/oracle/product/crs/11.2.0.3/bin/oraagent_grid__CRSD_MSG_FRAME_VERSION=2USER=gridINIT_VERSION=sysvinit-2.86__CLSAGENT_INCARNATION=2ORASYM=/opt/oracle/product/crs/11.2.0.3/bin/oraagent.binPATH=RUNLEVEL=3runlevel=3PWD=/ENV_FILE=/opt/oracle/product/crs/11.2.0.3/crs/install/s_crsconfig_oracleplayground_env.txtLANG=en_US.UTF-8TZ=Europe/Zurich__IS_HASD_AGENT=TRUEPREVLEVEL=Nprevious=N__CLSAGENT_LOG_NAME=ora.listener.type_gridHOME=/home/gridSHLVL=3__CLSAGENT_LOGDIR_NAME=ohasdLD_ASSUME_KERNEL=__CLSAGENT_USER_NAME=gridLOGNAME=gridORACLE_HOME=/opt/oracle/product/base/11.2.0.3ORACLE_SID=DB112ORA_NET2_DESC=34,37ORACLE_SPAWNED_PROCESS=1SKGP_SPAWN_DIAG_PRE_FORK_TS=1333453218SKGP_SPAWN_DIAG_POST_FORK_TS=1333453218SKGP_HIDDEN_ARGS=0SKGP_SPAWN_DIAG_PRE_EXEC_TS=1333453218[root@oracleplayground 2642]# 

… which files were opened by the process ?:

ls -la fd/
total 0
dr-x------ 2 root   root      0 Apr  3 13:40 .
dr-xr-xr-x 6 oracle asmadmin  0 Apr  3 13:40 ..
lr-x------ 1 root   root     64 Apr  3 16:23 0 -> /dev/null
l-wx------ 1 root   root     64 Apr  3 16:23 1 -> /dev/null
lr-x------ 1 root   root     64 Apr  3 16:23 10 -> /dev/null
lr-x------ 1 root   root     64 Apr  3 16:23 11 -> /dev/null
lr-x------ 1 root   root     64 Apr  3 16:23 12 -> /dev/null
lrwx------ 1 root   root     64 Apr  3 16:23 13 -> /opt/oracle/product/base/11.2.0.3/dbs/hc_DB112.dat
lr-x------ 1 root   root     64 Apr  3 16:23 14 -> /dev/null
lr-x------ 1 root   root     64 Apr  3 16:23 15 -> /dev/null
lr-x------ 1 root   root     64 Apr  3 16:23 16 -> /dev/zero
lr-x------ 1 root   root     64 Apr  3 16:23 17 -> /dev/zero
lrwx------ 1 root   root     64 Apr  3 16:23 18 -> /opt/oracle/product/base/11.2.0.3/dbs/hc_DB112.dat
lr-x------ 1 root   root     64 Apr  3 16:23 19 -> /opt/oracle/product/base/11.2.0.3/rdbms/mesg/oraus.msb
l-wx------ 1 root   root     64 Apr  3 16:23 2 -> /dev/null
lr-x------ 1 root   root     64 Apr  3 16:23 20 -> /proc/2875/fd
lr-x------ 1 root   root     64 Apr  3 16:23 21 -> /opt/oracle/product/crs/11.2.0.3/dbs/hc_+ASM.dat
lr-x------ 1 root   root     64 Apr  3 16:23 22 -> /dev/zero
lrwx------ 1 root   root     64 Apr  3 16:23 23 -> /opt/oracle/product/base/11.2.0.3/dbs/hc_DB112.dat
lrwx------ 1 root   root     64 Apr  3 16:23 24 -> /opt/oracle/product/base/11.2.0.3/dbs/lkDB112
lr-x------ 1 root   root     64 Apr  3 16:23 25 -> /opt/oracle/product/base/11.2.0.3/rdbms/mesg/oraus.msb
lrwx------ 1 root   root     64 Apr  3 16:23 256 -> /dev/sda1
lrwx------ 1 root   root     64 Apr  3 16:23 3 -> /opt/oracle/product/crs/11.2.0.3/log/oracleplayground/agent/ohasd/oraagent_grid/oraagent_gridOUT.log
l-wx------ 1 root   root     64 Apr  3 16:23 4 -> /opt/oracle/product/crs/11.2.0.3/log/oracleplayground/agent/ohasd/oraagent_grid/oraagent_grid.l01
lr-x------ 1 root   root     64 Apr  3 16:23 5 -> /dev/null
lrwx------ 1 root   root     64 Apr  3 16:23 6 -> socket:[7791]
lrwx------ 1 root   root     64 Apr  3 16:23 7 -> socket:[7792]
lrwx------ 1 root   root     64 Apr  3 16:23 8 -> socket:[7793]
lrwx------ 1 root   root     64 Apr  3 16:23 9 -> socket:[7794]

conclusion: it’s really worth to read the man pages and understand the /proc/[PID] structures. this can be a very good starting point if you have troubles with one of the processes running on your system.

and last but not least: maybe you don’t believe that the ps command is reading the /proc/[PID] structures to diplay it’s information. you can always trace the commands and check what’s happening behind:

strace -o strace.log ps -ef

this will write the strace output to a file named strace.log. grep for you smon process and check which files were read:

grep 2969 strace.log
stat("/proc/2969", {st_mode=S_IFDIR|0555, st_size=0, ...}) = 0
open("/proc/2969/stat", O_RDONLY)       = 6
read(6, "2969 (oracle) S 1 2921 2921 0 -1"..., 1023) = 191
open("/proc/2969/status", O_RDONLY)     = 6
open("/proc/2969/cmdline", O_RDONLY)    = 6
write(1, "oracle    2969     1  0 10:48 ? "..., 63) = 63

here we go: a subset of the same files listed above:

/proc/2969/stat
/proc/2969/status
/proc/2969/cmdline

happy processing …

if you have access to oracle support there is a good note about deploying the database on linux.

check it out:

Master Note of Linux OS Requirements for Database Server

did you ever had the situation where you’d want to quickly monitor how a filesystem grows or what gets written to it without typing the commands again and again ?

some examples:

watch "ls -latr"
Every 2.0s: ls -latr Tue Apr 3 08:29:48 2012
total 60
-rw-r--r-- 1 oracle oinstall 515 Mar 23 08:41 .emacs
-rw-r--r-- 1 oracle oinstall 124 Mar 23 08:41 .bashrc
-rw-r--r-- 1 oracle oinstall 33 Mar 23 08:41 .bash_logout
drwxr-xr-x 4 root root 4096 Mar 23 08:41 ..
drwxr-xr-x 3 oracle oinstall 4096 Mar 26 14:34 oradiag_oracle
-rw-r--r-- 1 oracle oinstall 685 Mar 26 14:36 .bash_profile
-rw------- 1 oracle oinstall 1802 Mar 28 13:06 .viminfo
drwx------ 3 oracle oinstall 4096 Mar 28 13:06 .
-rw------- 1 oracle oinstall 6626 Mar 28 16:36 .bash_history

Without providing any additional arguments watch displays the command one provides and refreshes the output every two seconds.

Another example:
watch -d -n 5 -t "ls -latr"
total 60
-rw-r--r-- 1 oracle oinstall 515 Mar 23 08:41 .emacs
-rw-r--r-- 1 oracle oinstall 124 Mar 23 08:41 .bashrc
-rw-r--r-- 1 oracle oinstall 33 Mar 23 08:41 .bash_logout
drwxr-xr-x 4 root root 4096 Mar 23 08:41 ..
drwxr-xr-x 3 oracle oinstall 4096 Mar 26 14:34 oradiag_oracle
-rw-r--r-- 1 oracle oinstall 685 Mar 26 14:36 .bash_profile
-rw------- 1 oracle oinstall 1802 Mar 28 13:06 .viminfo
-rw------- 1 oracle oinstall 6626 Mar 28 16:36 .bash_history
-rw-r--r-- 1 oracle oinstall 0 Apr 3 08:34 a
drwx------ 3 oracle oinstall 4096 Apr 3 08:34 .

“-d” highlightes the differences since the last refresh
“-n” specifies the refresh interval
“-t” supresses the heading

grepping?
watch -t "grep aaa" bbb

happy watching…

To summarize all the posts which will get you to your test infrastructure, here is the overview:

  1. Operating System setup
  2. Operating System preperation for oracle
  3. Grid Infrastrucuture Installation
  4. Applying the Latest Patchset Update for the Grid Infrastructure
  5. Creating the ASM instance
  6. Database Software Installation
  7. Creating the database
  8. Applying the Latest Patchset Update for the database

I could have applied the PSU earlier ( before creating the database ), but in real life this is the more likely scenario. As the patch sources are already in place:

su - oracle
cd /opt/oracle/stage
ls -la
6880880_112000_Linux-x86-64.zip
p13348650_112030_Linux-x86-64.zip
opatch_response.rsp

start with updating opatch:

unzip p6880880_112000_Linux-x86-64.zip -d $ORACLE_HOME/

It is safe to answer “All” if the unzip utility ask to replace some files.

Extract and check the readme:

unzip p13348650_112030_LINUX.zip

The structure of the oracle patches is always the same. You will get subdirectories named with the patch number and the readme:

ls -la
drwxr-xr-x 4 oracle oinstall 4096 Jan 14 17:08 13343438
drwxr-xr-x 5 oracle oinstall 4096 Jan 14 17:08 13348650
-rw-r--r-- 1 oracle oinstall 422 Jan 14 17:08 bundle.xml
-rwxrwx--- 1 grid oinstall 621 Mar 23 11:31 opatch_response.rsp
-rwxrwx--- 1 grid oinstall 32510817 Mar 23 10:54 p6880880_112000_Linux-x86-64.zip
-rw-rw-r-- 1 oracle oinstall 107674 Jan 16 14:49 README.html
-rw-r--r-- 1 oracle oinstall 21 Jan 14 17:08 README.txt

Because this patch contains both, the database and the grid patches, change to the database patch directory ( which is 13343438 ) and apply the patchset:

cd /opt/oracle/stage/13343438
srvctl stop listener -l listener_DB112
srvctl stop database -d DB112
export PATH=$ORACLE_HOME/OPatch:$PATH
opatch lsinventory -detail -oh $ORACLE_HOME
opatch prereq CheckConflictAgainstOHWithDetail -phBaseDir /opt/oracle/stage/13343438 -oh $ORACLE_HOME
$ORACLE_HOME/OPatch/ocm/bin/emocmrsp -output /opt/oracle/stage/opatch_response.rsp -no_banner
opatch apply -ocmrf /opt/oracle/stage/opatch_response.rsp

The output should be very similar to this:

Oracle Home : /opt/oracle/product/base/11.2.0.3
Central Inventory : /opt/oracle/oraInventory
from : /opt/oracle/product/base/11.2.0.3/oraInst.loc
OPatch version : 11.2.0.3.0
OUI version : 11.2.0.3.0
Log file location : /opt/oracle/product/base/11.2.0.3/cfgtoollogs/opatch/13343438_Mar_28_2012_15_35_47/apply2012-03-28_15-35-47PM_1.log
Applying interim patch '13343438' to OH '/opt/oracle/product/base/11.2.0.3'
Verifying environment and performing prerequisite checks...
All checks passed.
Please shutdown Oracle instances running out of this ORACLE_HOME on the local system.
(Oracle Home = '/opt/oracle/product/base/11.2.0.3')
Is the local system ready for patching? [y|n]
y
User Responded with: Y
Backing up files...
Patching component oracle.rdbms.rsf, 11.2.0.3.0...
Patching component oracle.rdbms, 11.2.0.3.0...
Patching component oracle.rdbms.dbscripts, 11.2.0.3.0...
Verifying the update...
Patch 13343438 successfully applied
Log file location: /opt/oracle/product/base/11.2.0.3/cfgtoollogs/opatch/13343438_Mar_28_2012_15_35_47/apply2012-03-28_15-35-47PM_1.log
OPatch succeeded.

Patch ( almost ) applied.

Perhaps you noticed that opatch creates a new directory under you ORACLE_HOME which is called .patch_storage:

ls -la /opt/oracle/product/base/11.2.0.3/.patch_storage/
total 28
drwxr-xr-x 4 oracle oinstall 4096 Mar 28 15:38 .
drwxrwx--- 75 oracle oinstall 4096 Mar 28 15:36 ..
drwxr-xr-x 4 oracle oinstall 4096 Mar 28 15:38 13343438_Jan_3_2012_02_50_27
-rw-r--r-- 1 oracle oinstall 336 Mar 28 15:36 interim_inventory.txt
-rw-r--r-- 1 oracle oinstall 92 Mar 28 15:36 LatestOPatchSession.properties
-rw-r--r-- 1 oracle oinstall 0 Mar 28 15:38 patch_free
-rw-r--r-- 1 oracle oinstall 51 Mar 28 15:36 record_inventory.txt
drwxr-xr-x 2 oracle oinstall 4096 Mar 28 15:38 verify

Under no circumstances delete this files. You will not be able apply any futures patches if you do this. If you really experience space issues, you can do a cleanup of the files which are not needed:

opatch util cleanup

One step is still missing. It it very likely that oracle modified some SQL files with this patch, so one needs to apply this, too:

srvctl start listener -l listener_DB112
srvctl start database -d DB112
sqlplus / as sysdba
@?/psu/11.2.0.3.1/catpsu.sql
select * from registry$history;

Work done.

Now there is a working Grid Infrastructure and database each patched to the ( currently ) latest release. If you did not export your Virtual Machine and did not create any snapshots I recommend to do an export now ( you need to shutdown your Virtual Machine for this ):

vboxmanage export "oracleplayground" --output oracleplayground.ovf

If you destroy the database or any parts of the grid infrastructure you are always able to bring it back in a few minutes.

Where to go from now ? This depends on you. If you are new to oracle there is a lot of literature out there, but the most important ( and at no cost ): Oracle Database Concepts . This should be your starting point.

Before I start with the database creation, there remain some steps to be performed. Because I will place the files inside the ASM instance there is no need to create separate filesystems for datafiles, redologs, control-files. But still I want a custom location for the audit logs, pfile and diagnostic destination. Let’s prepare this:

su -
mkdir /oradata/DB112
chown oracle:dba /oradata/DB112
su - oracle
mkdir -p /oradata/DB112/admin/pfile
mkdir /oradata/DB112/admin/adump

The easiest, and probably the best way for most environments is to go with the defaults. Let’s start by creating a minimal pfile…

su - oracle
echo "*.audit_file_dest='/oradata/DB112/admin/adump'
*.control_files='+DB112_DATA_DG','+DB112_ARCH_DG'
*.db_block_size=8192
*.db_name='DB112'
*.instance_name='DB112'
*.sga_max_size=256M
*.sga_target=256M
*.undo_tablespace='undotbs1'
*.diagnostic_dest=/oradata/DB112/admin" > /oradata/DB112/admin/pfile/initDB112.ora

… check that we can initially start the instance…

sqlplus / as sysdba
startup force nomount pfile=/oradata/DB112/admin/pfile/initDB112.ora

… create the server parameter file:

create spfile='/oradata/DB112/admin/pfile/spfileDB112.ora' from pfile='/oradata/DB112/admin/pfile/initDB112.ora';

… create a link to the server parameter file ( for oracle to find the file )

!ln -s /oradata/DB112/admin/pfile/spfileDB112.ora $ORACLE_HOME/dbs/spfileDB112.ora

… restart without specifying a pfile to see if the spfile gets used:

startup force nomount
show parameter pfile;

… and create the database

create database DB112
logfile
group 1 ('+DB112_DATA_DG','+DB112_ARCH_DG') size 16M reuse,
group 2 ('+DB112_DATA_DG','+DB112_ARCH_DG') size 16M reuse,
group 3 ('+DB112_DATA_DG','+DB112_ARCH_DG') size 16M reuse
character set utf8
national character set AL16UTF16
datafile '+DB112_DATA_DG' size 512M reuse autoextend on next 8M maxsize 1024M extent management local
default temporary tablespace TEMP tempfile '+DB112_DATA_DG' size 64M reuse autoextend on next 8M maxsize 1024M
sysaux datafile '+DB112_DATA_DG' size 512M reuse autoextend on next 8M maxsize 1024M
default tablespace USERS datafile '+DB112_DATA_DG' size 4m reuse autoextend on next 8m maxsize 16M
undo tablespace UNDOTBS1 datafile '+DB112_DATA_DG' size 64M reuse autoextend on next 8M maxsize 1024M;

… create the dictionary:

@?/rdbms/admin/catalog.sql

… and the plsql stuff:

@?/rdbms/admin/catproc.sql

… create the help tables for sqlplus and populate it:

@?/sqlplus/admin/help/hlpbld.sql helpus.sql
shutdown immediate;
exit;

Done. Database created. What else ? Right, register the database with the Cluster Stack and create a listener:

srvctl add database -d DB112 -o $ORACLE_HOME -p $ORACLE_HOME/dbs/spfileDB112.ora
srvctl add listener -l listener_DB112 -p 1521 -o $ORACLE_HOME
touch chmod 770 /opt/oracle/product/base/11.2.0.3/network/admin/listener.ora
chmod 770 /opt/oracle/product/base/11.2.0.3/
chmod 770 /opt/oracle/product/base/11.2.0.3/dbs
chmod 770 /opt/oracle/product/base/11.2.0.3/network/
chmod 770 /opt/oracle/product/base/11.2.0.3/network/admin
chmod 770 /opt/oracle/product/base/11.2.0.3/network/admin/listener.ora
srvctl start listener -l listener_DB112
srvctl start database -d DB112

Please notice: The chmods are dirty tricks to avoid CRS-5010 issues. The reason for the CRS-5010 messages is that the cluster stack runs under a different user ( grid in this case ) and is not able to update the files. Maybe there is a fix in the future.

Let’s check the resources and do a reboot to check if all comes up again:

su - grid
crsctl status resource -t
su -
reboot
su - grid
crsctl status resource -t

You should see that the resources are up and running, something like:

+ASM@oracleplayground.fun grid:/home/grid $ crsctl status resource -t
--------------------------------------------------------------------------------
NAME TARGET STATE SERVER STATE_DETAILS
--------------------------------------------------------------------------------
Local Resources
--------------------------------------------------------------------------------
ora.DB112_ARCH_DG.dg
ONLINE ONLINE oracleplayground
ora.DB112_DATA_DG.dg
ONLINE ONLINE oracleplayground
ora.LISTENER_ASM.lsnr
ONLINE ONLINE oracleplayground
ora.LISTENER_DB112.lsnr
ONLINE ONLINE oracleplayground
ora.asm
ONLINE ONLINE oracleplayground Started
ora.ons
OFFLINE OFFLINE oracleplayground
--------------------------------------------------------------------------------
Cluster Resources
--------------------------------------------------------------------------------
ora.cssd
1 ONLINE ONLINE oracleplayground
ora.db112.db
1 ONLINE ONLINE oracleplayground Open
ora.diskmon
1 OFFLINE OFFLINE
ora.evmd
1 ONLINE ONLINE oracleplayground

For your convenience, here the complete database creation script:

echo "*.audit_file_dest='/oradata/DB112/admin/adump'
*.control_files='+DB112_DATA_DG','+DB112_ARCH_DG'
*.db_block_size=8192
*.db_name='DB112'
*.instance_name='DB112'
*.sga_max_size=256M
*.sga_target=256M
*.undo_tablespace='undotbs1'
*.diagnostic_dest=/oradata/DB112/admin" > /oradata/DB112/admin/pfile/initDB112.ora
sqlplus / as sysdba
startup force nomount pfile=/oradata/DB112/admin/pfile/initDB112.ora
create spfile='/oradata/DB112/admin/pfile/spfileDB112.ora' from pfile='/oradata/DB112/admin/pfile/initDB112.ora';
!ln -s /oradata/DB112/admin/pfile/spfileDB112.ora $ORACLE_HOME/dbs/spfileDB112.ora
startup force nomount
show parameter pfile;
create database DB112
logfile
group 1 ('+DB112_DATA_DG','+DB112_ARCH_DG') size 16M reuse,
group 2 ('+DB112_DATA_DG','+DB112_ARCH_DG') size 16M reuse,
group 3 ('+DB112_DATA_DG','+DB112_ARCH_DG') size 16M reuse
character set utf8
national character set AL16UTF16
datafile '+DB112_DATA_DG' size 512M reuse autoextend on next 8M maxsize 1024M extent management local
default temporary tablespace TEMP tempfile '+DB112_DATA_DG' size 64M reuse autoextend on next 8M maxsize 1024M
sysaux datafile '+DB112_DATA_DG' size 512M reuse autoextend on next 8M maxsize 1024M
default tablespace USERS datafile '+DB112_DATA_DG' size 4m reuse autoextend on next 8m maxsize 16M
undo tablespace UNDOTBS1 datafile '+DB112_DATA_DG' size 64M reuse autoextend on next 8M maxsize 1024M;
@?/rdbms/admin/catalog.sql
@?/rdbms/admin/catproc.sql
@?/sqlplus/admin/help/hlpbld.sql helpus.sql
shutdown immediate;
exit;
srvctl add database -d DB112 -o $ORACLE_HOME -p $ORACLE_HOME/dbs/spfileDB112.ora
srvctl add listener -l listener_DB112 -p 1521 -o $ORACLE_HOME
touch chmod 770 /opt/oracle/product/base/11.2.0.3/network/admin/listener.ora
chmod 770 /opt/oracle/product/base/11.2.0.3/
chmod 770 /opt/oracle/product/base/11.2.0.3/dbs
chmod 770 /opt/oracle/product/base/11.2.0.3/network/
chmod 770 /opt/oracle/product/base/11.2.0.3/network/admin
chmod 770 /opt/oracle/product/base/11.2.0.3/network/admin/listener.ora
srvctl start listener -l listener_DB112
srvctl start database -d DB112

…a customer needed a quick way for enabling index monitoring for a whole schema:

don’t know what index monitoring is? check the documentation

example calls:

@index_monitoring_bulk USER ON Y
@index_monitoring_bulk USER OFF Y

Script:

/**
enable index monitoring for a given user
   parameters: user, on/off, debug
       e.g. @index_monitoring_bulk USER ON Y
**/
SET SERVEROUT ON
SET LINES 164
SET VERIFY OFF
SET FEEDBACK OFF
CLEAR COLUMNS
VARIABLE for_user CHAR(30)
VARIABLE on_off CHAR(3)
VARIABLE debug_on CHAR(1)
BEGIN
  :for_user := '&1';
  :on_off := '&2';
  :debug_on := '&3';
END;
/
DECLARE
  lcb_debug CONSTANT BOOLEAN := :debug_on = 'Y';
  lcv_user CONSTANT all_users.username%TYPE := UPPER ( REPLACE ( :for_user, ' ','' ) );
  lcv_on_off CONSTANT VARCHAR2(3) := NVL ( REPLACE ( :on_off, ' ', '' ), 'OFF' );
  TYPE tab_index_names IS TABLE OF all_indexes.index_name%TYPE INDEX BY PLS_INTEGER;
  ltab_index_names tab_index_names;
  lv_statement VARCHAR2(2000);
  lv_monitoring_clause VARCHAR2(12);
  le_iot EXCEPTION;
  le_resouce_busy EXCEPTION;
  PRAGMA EXCEPTION_INIT(le_iot, -25176);
  PRAGMA EXCEPTION_INIT(le_resouce_busy, -00054);
  PROCEDURE debug ( pv_text IN VARCHAR2 )
  IS
  BEGIN
    IF ( lcb_debug )
    THEN
      dbms_output.put_line ( pv_text );
    END IF;
  END debug;
  FUNCTION user_exists ( pv_user IN all_users.username%TYPE )
                       RETURN BOOLEAN
  IS
    CURSOR cur_check_user
    IS SELECT 'does_exist'
         FROM all_users
        WHERE username = pv_user
    ;
    lv_cursor_result VARCHAR2(10);
  BEGIN
    debug ( ' Checking database for user: '|| lcv_user );
    OPEN cur_check_user;
      FETCH cur_check_user INTO lv_cursor_result;
    CLOSE cur_check_user;
    RETURN lv_cursor_result IS NOT NULL;
  END user_exists;
  PROCEDURE get_indexes_for_user ( pv_user IN all_users.username%TYPE )
  IS
    CURSOR cur_get_indexes_for_user
    IS SELECT index_name
         FROM all_indexes
        WHERE owner = pv_user
    ;
  BEGIN
    OPEN cur_get_indexes_for_user;
      FETCH cur_get_indexes_for_user BULK COLLECT INTO ltab_index_names;
    CLOSE cur_get_indexes_for_user;
  END get_indexes_for_user;
BEGIN
  IF user_exists ( pv_user => lcv_user )
  THEN
    IF lcv_on_off IN ('ON','OFF')
    THEN
      debug ( ' User: '||lcv_user||' does exist ');
      debug ( ' ON/OFF flag is: '||lcv_on_off );
      debug ( ' Loading indexes ' );
      get_indexes_for_user ( pv_user => lcv_user );
      IF ( lcv_on_off = 'ON' )
      THEN
        lv_monitoring_clause := 'MONITORING';
      ELSE
        lv_monitoring_clause := 'NOMONITORING';
      END IF;
      IF ltab_index_names IS NOT NULL
         AND
         ltab_index_names.COUNT > 0
      THEN
         FOR i IN ltab_index_names.FIRST..ltab_index_names.LAST
         LOOP
           debug ( ' Processing index: '||lcv_user||'.'||ltab_index_names(i) );
           lv_statement := 'ALTER INDEX "'||lcv_user||'"."'||ltab_index_names(i)||'" '||lv_monitoring_clause||' USAGE';
           debug ( ' Statement is: '||lv_statement );
           BEGIN
             EXECUTE IMMEDIATE lv_statement;
           EXCEPTION WHEN le_iot THEN debug ( ' --- Index monitoring not possible on IOTs, skipping' );
                     WHEN le_resouce_busy THEN debug ( ' --- Resource busy, propably SYS_ indexes ' );
           END;
         END LOOP;
      END IF;
    ELSE
      dbms_output.put_line ( ' ON/OFF flag must be ON or OFF ' );
    END IF;
  ELSE
    dbms_output.put_line ( ' User '||lcv_user|| ' does not exist ! ');
  END IF;
END;
/

After your usual workload check the results in v$object_usage:

SQL> desc v$object_usage;
 Name					   Null?    Type
 ----------------------------------------- -------- ----------------------------
 INDEX_NAME				   NOT NULL VARCHAR2(30)
 TABLE_NAME				   NOT NULL VARCHAR2(30)
 MONITORING					    VARCHAR2(3)
 USED						    VARCHAR2(3)
 START_MONITORING				    VARCHAR2(19)
 END_MONITORING 				    VARCHAR2(19)
SQL>