the previous post about SIGSEGV and the ORA-07445 introduced signals and how they are used by the kernel to notify processes about events.
many times I see people using the “kill -9” to terminate processes. no questions, this works most of the time, but a lot of people are not aware what they are actually doing when firing this command. in my opinion, kill is a really bad name for this command, because what kill is doing is not necessarily kill processes, but send signals to processes ( of which 9, or SIGKILL is probably the most well known ). a much better name, for example, would be “sig” or “signal”.
the list of signals one can use in regards to kill can be printed with:
kill -l
1) SIGHUP 2) SIGINT 3) SIGQUIT 4) SIGILL
5) SIGTRAP 6) SIGABRT 7) SIGBUS 8) SIGFPE
9) SIGKILL 10) SIGUSR1 11) SIGSEGV 12) SIGUSR2
13) SIGPIPE 14) SIGALRM 15) SIGTERM 16) SIGSTKFLT
17) SIGCHLD 18) SIGCONT 19) SIGSTOP 20) SIGTSTP
21) SIGTTIN 22) SIGTTOU 23) SIGURG 24) SIGXCPU
25) SIGXFSZ 26) SIGVTALRM 27) SIGPROF 28) SIGWINCH
29) SIGIO 30) SIGPWR 31) SIGSYS 34) SIGRTMIN
35) SIGRTMIN+1 36) SIGRTMIN+2 37) SIGRTMIN+3 38) SIGRTMIN+4
39) SIGRTMIN+5 40) SIGRTMIN+6 41) SIGRTMIN+7 42) SIGRTMIN+8
43) SIGRTMIN+9 44) SIGRTMIN+10 45) SIGRTMIN+11 46) SIGRTMIN+12
47) SIGRTMIN+13 48) SIGRTMIN+14 49) SIGRTMIN+15 50) SIGRTMAX-14
51) SIGRTMAX-13 52) SIGRTMAX-12 53) SIGRTMAX-11 54) SIGRTMAX-10
55) SIGRTMAX-9 56) SIGRTMAX-8 57) SIGRTMAX-7 58) SIGRTMAX-6
59) SIGRTMAX-5 60) SIGRTMAX-4 61) SIGRTMAX-3 62) SIGRTMAX-2
63) SIGRTMAX-1 64) SIGRTMAX
here you can see, what 9 really means, it is SIGKILL. the ( perhaps ) dangerous about SIGKILL is, that the process will not be allowed to do any cleanup ( for example releasing resources ). as this signal can not be ignored or caught, the process will terminate immediately ( you can compare it to the “shutdown abort” command of the oracle database ).
the way one should terminate processes is to use the SIGTERM (15) signal, the default parameter for kill. this allows the process to do its cleanup work and to safely terminate ( although this is dependent on how the process or the applications handles the signal ).
once interesting thing you can do by sending a signal to a process with kill is to force, for example, the ssh daemon to re-read its configuration without closing the active ssh sessions. you can try this with:
kill -HUP [PID_OF_SSHD]
be aware that this must not be true for other daemons, as this depends on how the program was implemented. the default behavior for SIGHUP ( hang up ) is abnormal termination. originally the SIGHUP comes from serial connections ( e.g. modems ) which indeed did a hang up when the user closed the connection.
closing the loop to the previous post about SIGSEGV and the ORA-07445 you can force an ORA-07445 by sending the SIGSEGV signal, for example, to the dbwriter process ( I hope there is no need to say: you should not try this on a production system ):
ps -ef | grep dbw
oracle 4560 1 0 13:18 ? 00:00:00 ora_dbw0_DB112
kill -11 4560
…which will result in the following errors reported in the alertlog:
Exception [type: SIGSEGV, unknown code] [ADDR:0xC41] [PC:0x32E7CD46BA, semtimedop()+10] [exception issued by pid: 3137, uid: 0] [flags: 0x0, count: 1]
Errors in file /oradata/DB112/admin/diag/rdbms/db112/DB112/trace/DB112_dbw0_4560.trc (incident=26003):
ORA-07445: exception encountered: core dump [semtimedop()+10] [SIGSEGV] [ADDR:0xC41] [PC:0x32E7CD46BA] [unknown code] []
Incident details in: /oradata/DB112/admin/diag/rdbms/db112/DB112/incident/incdir_26003/DB112_dbw0_4560_i26003.trc
Use ADRCI or Support Workbench to package the incident.
See Note 411.1 at My Oracle Support for error and packaging details.
Mon Apr 16 13:23:36 2012
for simulating a power failure try to send the SIGPWR to a sqlplus session. this will result in:
SQL>
SQL>
SQL> Power failure
conclusion: signals are one more important concept when it comes to understanding the operating system. by sending signals processes are notified about events and are given the chance to take the necessary actions ( if an appropriate handler is present ). when using the kill command you do not necessarily kill a process. what you are doing is sending a signal.
as usual, this is just an introduction and far from being complete ….

 standard
 pdf
pdf
 htop.sourceforge.net/htop-1.0.2-io.png
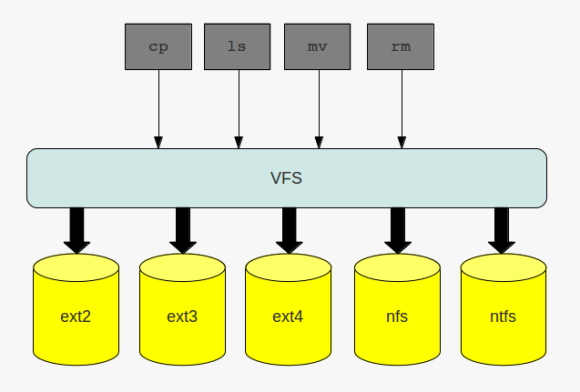 the virtual file system
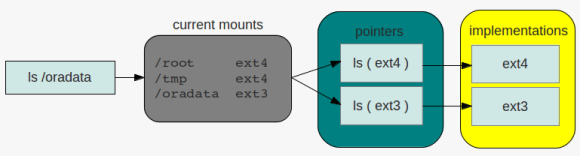 directory listing
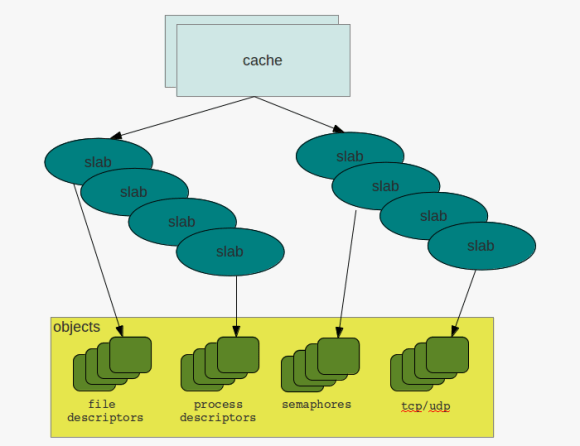 caches & slabs
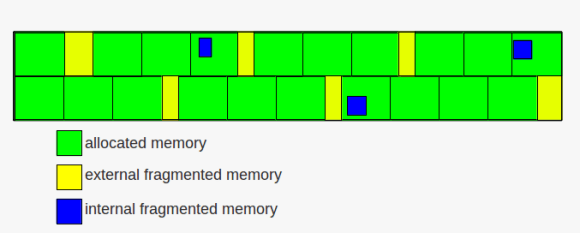 memory fragmentation